Summary of the DFT calculations
advertisement
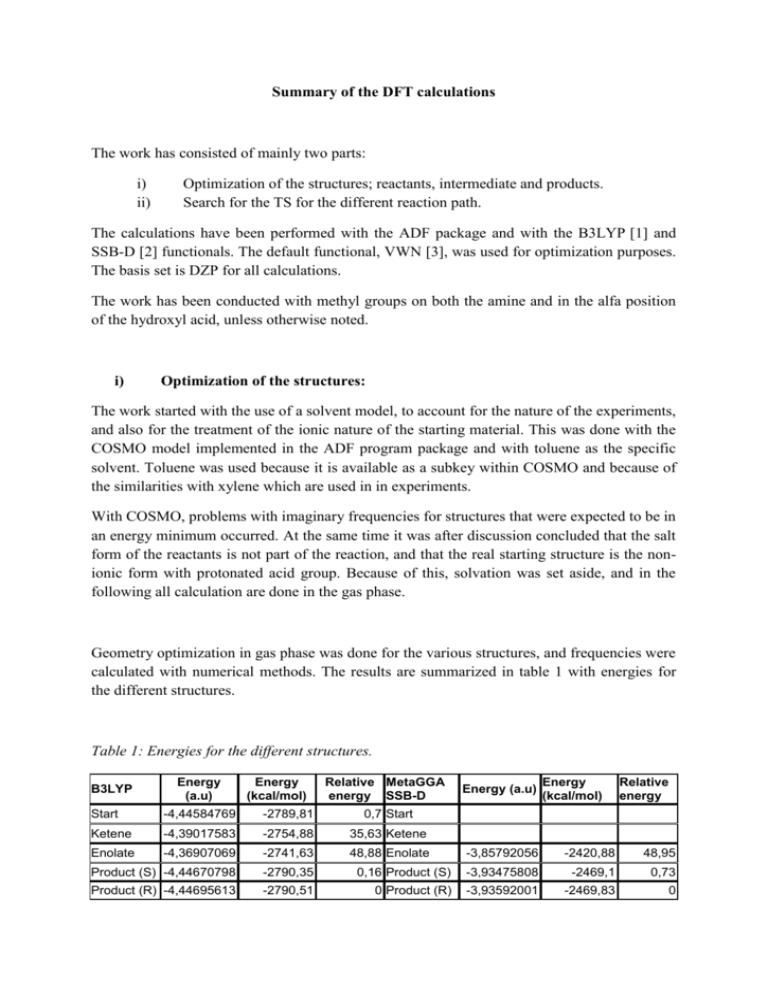
Summary of the DFT calculations The work has consisted of mainly two parts: i) ii) Optimization of the structures; reactants, intermediate and products. Search for the TS for the different reaction path. The calculations have been performed with the ADF package and with the B3LYP [1] and SSB-D [2] functionals. The default functional, VWN [3], was used for optimization purposes. The basis set is DZP for all calculations. The work has been conducted with methyl groups on both the amine and in the alfa position of the hydroxyl acid, unless otherwise noted. i) Optimization of the structures: The work started with the use of a solvent model, to account for the nature of the experiments, and also for the treatment of the ionic nature of the starting material. This was done with the COSMO model implemented in the ADF program package and with toluene as the specific solvent. Toluene was used because it is available as a subkey within COSMO and because of the similarities with xylene which are used in in experiments. With COSMO, problems with imaginary frequencies for structures that were expected to be in an energy minimum occurred. At the same time it was after discussion concluded that the salt form of the reactants is not part of the reaction, and that the real starting structure is the nonionic form with protonated acid group. Because of this, solvation was set aside, and in the following all calculation are done in the gas phase. Geometry optimization in gas phase was done for the various structures, and frequencies were calculated with numerical methods. The results are summarized in table 1 with energies for the different structures. Table 1: Energies for the different structures. B3LYP Energy (a.u) Energy (kcal/mol) Relative MetaGGA energy SSB-D Start -4,44584769 -2789,81 0,7 Start Ketene -4,39017583 -2754,88 35,63 Ketene Enolate -4,36907069 -2741,63 48,88 Enolate Product (S) -4,44670798 -2790,35 Product (R) -4,44695613 -2790,51 Energy (a.u) Energy (kcal/mol) Relative energy -3,85792056 -2420,88 48,95 0,16 Product (S) -3,93475808 -2469,1 0,73 0 Product (R) -3,93592001 -2469,83 0 Further on, optimization were also done on tartaric acid and on the ketene and enolate of tartaric acid. This was done to get a picture of the relative energies for the “real” structures. The results are summarized in table 2 with energies and the name of the belonging .xyz and .inp files. Table 2: Energies and filenames for the different structures based on tartaric acid, with the VWN functional. VWN Energy (a.u) Energy (kcal/mol) Relative energy Start -5,25176696 -3295,53 19,18 Startb -5,2416461 -3289,18 25,53 Ketene -5,19635292 -3260,76 53,95 Enolate -5,21346876 -3271,5 43,21 Product -5,28232618 -3314,71 0 It is important to note that only relative energies are relevant. For every structure in table 1 and 2, the IR spectra were calculated, and the structures had no imaginary frequencies. It can therefore be concluded that these structures are in an energy minimum. When the geometry of the ketene was optimized, it was observed addition of the amine to the ketene. This structure can look like the expected TS, and in addition, it showed one imaginary frequency in a frequency run. This happened for both the tartaric acid and the simplified structure. For the total structure, ther following was observed: Length of amide bond: 1,5737 Å in the observed structure and 1,3467 Å in the product. The optimized structure for the enolate showed the preference for the anime hydrogen bonded to the two hydroxy group. The amine ended up on the same side as the proton transfer happened, as can be observed in figure 1 and enol.xyz. This may facilitate a fast transfer of the proton, and therefore no racemization can occur. Figure 1; Optimized structure of the enolate. ii) Climbing Image Nudged Elastic Band (CINEB) For location of the TS for the different pathways the CINEB method in the ADF package was used. It is assumed that the direct addition and the last step in the enolate mechanism is the same. This leads to four different steps that need to be evaluated. i) Direct addition ii) Enolate formation enolform.inp iii) Ketene formation cinebc,6,78.xyz; 1,8827 Å (Not optimized) iv) Addition to ketene In conclusion, the CINEB method gave some structures that could resemble TS, but it never converged. If it is to be used, it must be worked out more properly. Summary The relative energies for the simplified structures show that the ketene is lower in energy than the enolate. Partly, this can be indicative for that the ketene pathway is more favorable for explaining the racemization. More important is the optimized structure of the enolate that shows that the amine is positioned so that the proton will go back to the same side as it came off. This will produce the same stereo chemistry. The amine shows an tendency in geometry optimizations to attack the ketene, leading to an product/TS like structure. That can mean that the ketene and the product/TS is relatively close in energy. References: [1]: P.J. Stephens, F.J. Devlin, C.F. Chabalowski and M.J. Frisch, Ab Initio Calculation of Vibrational Absorption and Circular Dichroism Spectra Using Density Functional Force Fields. Journal of Physical Chemistry 98, 11623 (1994) [2] M. Swart, M. Solà and F.M. Bickelhaupt, A new all-round DFT functional based on spin states and SN2 barriers, Journal of Chemical Physics 131, 094103 (2009) [3] S.H. Vosko, L. Wilk and M. Nusair, Accurate spin-dependent electron liquid correlation energies for local spin density calculations: a critical analysis. Canadian Journal of Physics 58 (8), 1200 (1980)
