Reaction Kinetics Lab
advertisement
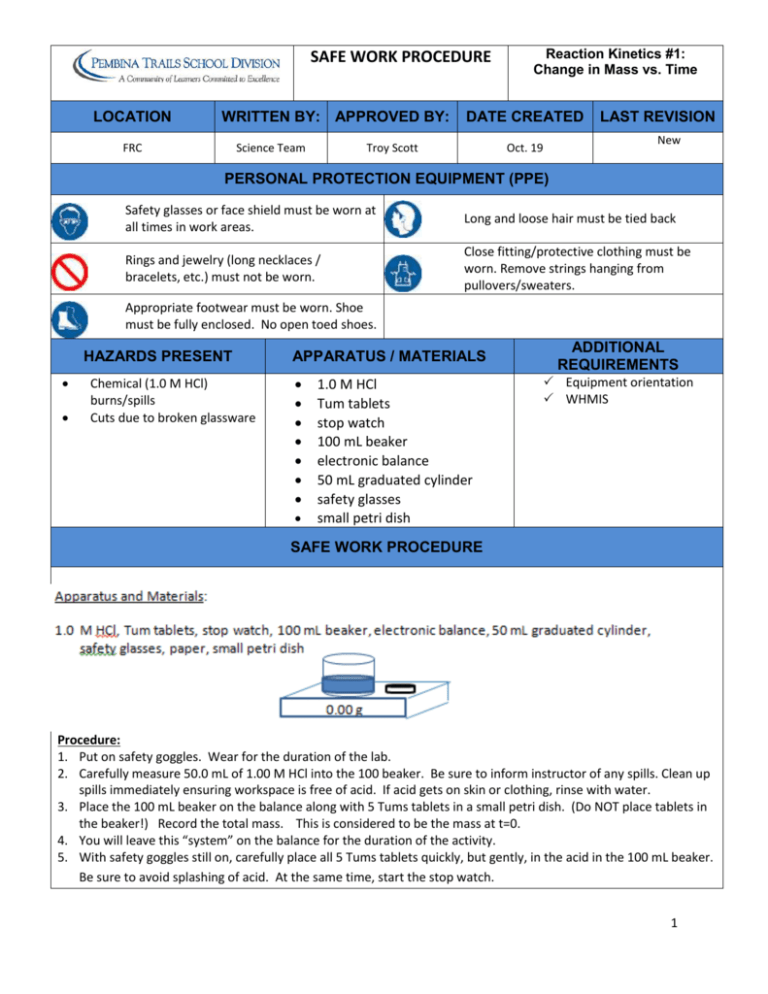
SAFE WORK PROCEDURE LOCATION WRITTEN BY: APPROVED BY: FRC Science Team Reaction Kinetics #1: Change in Mass vs. Time DATE CREATED Troy Scott Oct. 19 LAST REVISION New PERSONAL PROTECTION EQUIPMENT (PPE) Safety glasses or face shield must be worn at all times in work areas. Long and loose hair must be tied back Rings and jewelry (long necklaces / bracelets, etc.) must not be worn. Close fitting/protective clothing must be worn. Remove strings hanging from pullovers/sweaters. Appropriate footwear must be worn. Shoe must be fully enclosed. No open toed shoes. HAZARDS PRESENT Chemical (1.0 M HCl) burns/spills Cuts due to broken glassware APPARATUS / MATERIALS 1.0 M HCl Tum tablets stop watch 100 mL beaker electronic balance 50 mL graduated cylinder safety glasses small petri dish ADDITIONAL REQUIREMENTS Equipment orientation WHMIS SAFE WORK PROCEDURE Procedure: 1. Put on safety goggles. Wear for the duration of the lab. 2. Carefully measure 50.0 mL of 1.00 M HCl into the 100 beaker. Be sure to inform instructor of any spills. Clean up spills immediately ensuring workspace is free of acid. If acid gets on skin or clothing, rinse with water. 3. Place the 100 mL beaker on the balance along with 5 Tums tablets in a small petri dish. (Do NOT place tablets in the beaker!) Record the total mass. This is considered to be the mass at t=0. 4. You will leave this “system” on the balance for the duration of the activity. 5. With safety goggles still on, carefully place all 5 Tums tablets quickly, but gently, in the acid in the 100 mL beaker. Be sure to avoid splashing of acid. At the same time, start the stop watch. 1 6. Record the mass of the system every 30 s for the next 12 minutes. REGULATORY REQUIREMENTS WS&H Act W210, Section 4, 5 Mb. Regulations 217/2006, Part 16, (Machines / Tools & Robots) Sections 16.1-16.18) Part 35, (WHMIS Application) Part 36, (Chemical & Biological Substances Application) CH42S Reaction Kinetics: Reaction Rates and Graphical Methods Name: _____________________________ We can get a reasonable indication of the rate of a chemical event by measuring someobervable and changing property that is linked to that event as time passes. For example, the moles, concentration, mass, and pressure exerted by products tend to all increase while, at the same time, reactant quantities are gradually depleted. We need only find a good method of tracking one of these quantities during the lifetime of the event in order to provide appropriate data to determine the rate of the reaction. The specific chemical event you will study during this activity is symbolized below: 2HCl(aq) + CaCO3(aq) → CaCl2(aq) + H2O(l) + CO2(g) Prelab Exercise: Study the reaction above closely. It is always helpful to examine the physical states. Propose a number of different properties which will change during this experiment (at least 4 different types). Indicate whether the property will increase or decrease in quantity as time passes. Suggest how you might measure this property. Do not include the property which is ultimately used and describe in the method that follows. Purpose: a) To precisely monitor the mass of CO2 gas produced for about 12 minutes. b) To determine the average reaction rate for various intervals. c) To determine the instantaneous reaction rate for certain times. Apparatus and Materials: See SWP above Personal Protection: safety goggles must be worn at all times. No open-toed shoes. 2 Hazards Present: Burns from acid. Wipe up any spills that occur immediately. If acid gets on hands or clothes, rinse under water immediately. Procedure: See SWP above Analysis Part 1: 1. Construct a table (Table 1) that can display time (minutes), system mass (g) and mass of CO 2 produced (g). 2. Plot a graph (Fig. 1) of mass of CO2 produced vs. time. Fully label it and give it a title. Make 2 photocopies of this graph for a total of 3 copies. Be sure the copies are dark enough to show the grid lines on the graph. Analysis Part 2: Using Table 1 only, calculate the following: (show all work) 1. Rav for the entire 12 minutes 2. Rav for the first 3 minutes. 3. Rav from 2 - 6 minutes. 4. Rav from 9 – 12 minutes. Analysis Part 3: Using Figure 1 only, calculate the following: For each question, show the work both on the graph (graph # as indicated below) and as a separate calculation. 1. Rav for 12 – 100s (use graph copy #1) Rav for 4.2 min – 11.8 min (use graph copy #1) 2. Rinst. for t = 1.5 min (graph copy #2) Rinst for 4.0 min (graph copy #2) 3. Rav for entire process (graph #3) Rinst for t = 12 min. (graph #3) Questions: 1. Give a statement which characterizes the mass of CO2 produced as time passes. 2. Is the change in CO2 mass produced uniform? Explain. 3. When is the rate of production the lowest? State how you know (use table and graph). 4. When is the rate of production the highest? State how you know (use table and graph). 5. Consider the interval between 2 – 6 minutes. Examine the average reaction rate that you calculated for this interval. Now examine the instantaneous reaction rate at t=4.0 min. Report each of these values. Calculate the % difference between them. What should the ideal % difference be between these values? Explain. 6. Calculate the average reaction rate in moles/Ls (Ms-) for 0 – 3 minutes. 3 7. For that same interval (0-3 min), determine the average rate (in Ms-) of: a) Loss of HCl b) gain of CaCl2 8. You did this experiment at room temperature. If you performed the experiment at a higher temperature, would it be valid for us to compare the results of the two experiments? Explain. Evaluation: Prelab: (4) Table: (4) Graph (with copies): (5) Analysis Part 2: (8) Analysis Part 3: (12) Questions: (12) Overall Quality: (3) Total: / 48 4
