Chemistry Lab Report: Mass, Volume, Density
advertisement
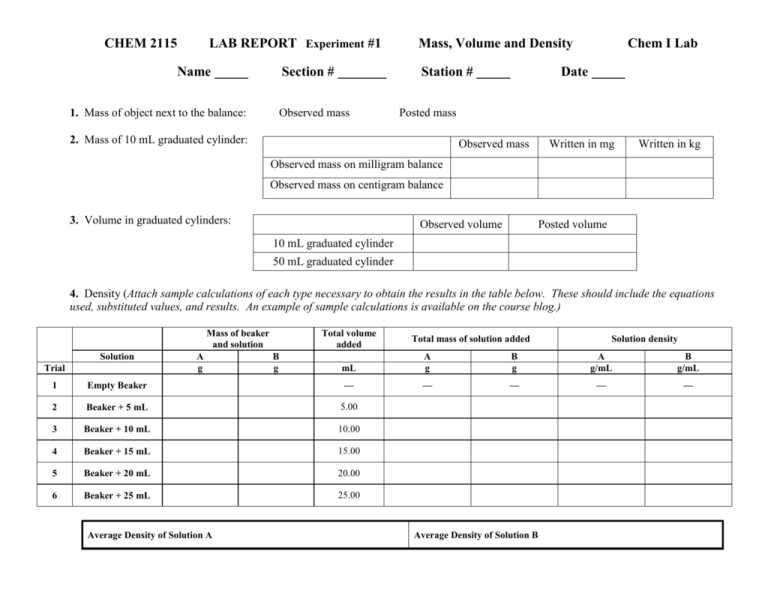
CHEM 2115 LAB REPORT Experiment #1 Name 1. Mass of object next to the balance: Section # Mass, Volume and Density Station # Observed mass Chem I Lab Date Posted mass 2. Mass of 10 mL graduated cylinder: Observed mass Written in mg Written in kg Observed mass on milligram balance Observed mass on centigram balance 3. Volume in graduated cylinders: Observed volume Posted volume 10 mL graduated cylinder 50 mL graduated cylinder 4. Density (Attach sample calculations of each type necessary to obtain the results in the table below. These should include the equations used, substituted values, and results. An example of sample calculations is available on the course blog.) Mass of beaker and solution Solution Trial A g Total volume added B g Solution density mL A g B g A g/mL B g/mL — — — — 1 Empty Beaker — 2 Beaker + 5 mL 5.00 3 Beaker + 10 mL 10.00 4 Beaker + 15 mL 15.00 5 Beaker + 20 mL 20.00 6 Beaker + 25 mL 25.00 Average Density of Solution A Total mass of solution added Average Density of Solution B Q1. a. How did the calculated value of the density for the ‘beaker + 5 mL’ compare to the sample for the ‘beaker + 25 mL’ for Solution A? b. According to our textbook by Brady, “density is independent of sample size.” Does your data support this statement? Explain why or why not. Prepare a plot with Total Volume on the X axis and the Mass of the Beaker with Solution on the Y axis. Plot two data sets - one for Solution A and one for Solution B. Using a straight edge, draw the best straight lines through each of these data sets. For each line, find the slope and intercept. Submit the plot as part of the lab report. Graph paper is available on Blackboard for this purpose. Q2. What are the values of the y intercepts for these two lines? What physical quantity do these values represent? Are they similar or different? How well do they compare to your experimental values for this quantity? Q3. What are the values of the slopes for these two lines? What physical quantity do these values represent? Are they similar or different? How well do they compare to your experimental values for this quantity?
