Chapter 10 VLOOKUP Tutorial
advertisement
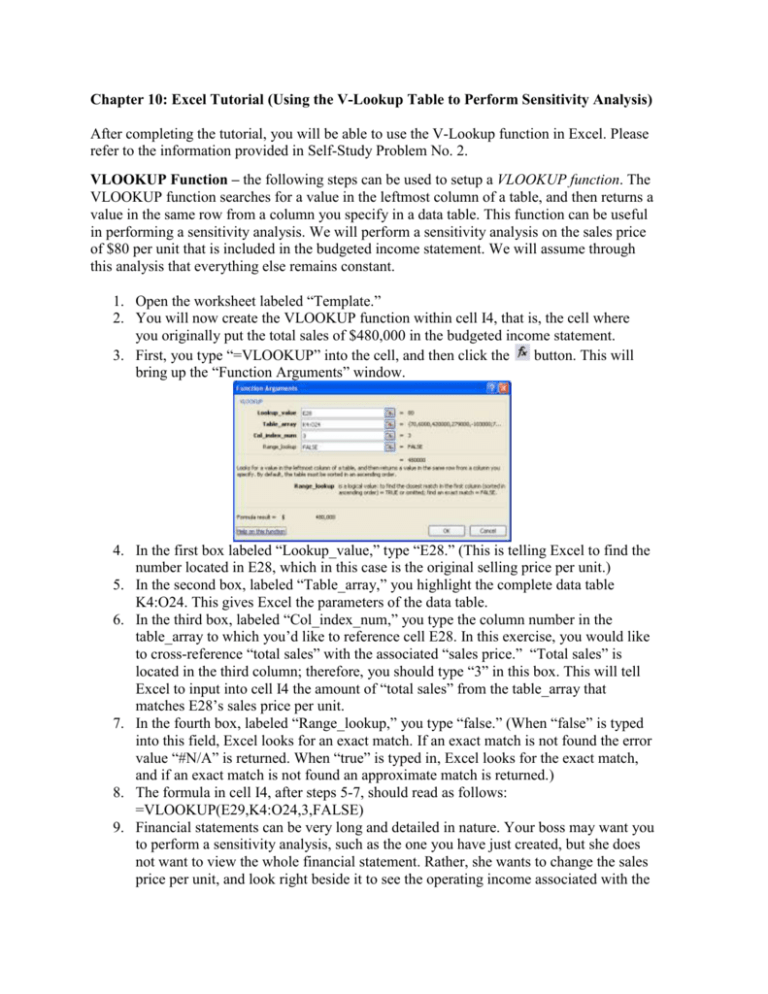
Chapter 10: Excel Tutorial (Using the V-Lookup Table to Perform Sensitivity Analysis) After completing the tutorial, you will be able to use the V-Lookup function in Excel. Please refer to the information provided in Self-Study Problem No. 2. VLOOKUP Function – the following steps can be used to setup a VLOOKUP function. The VLOOKUP function searches for a value in the leftmost column of a table, and then returns a value in the same row from a column you specify in a data table. This function can be useful in performing a sensitivity analysis. We will perform a sensitivity analysis on the sales price of $80 per unit that is included in the budgeted income statement. We will assume through this analysis that everything else remains constant. 1. Open the worksheet labeled “Template.” 2. You will now create the VLOOKUP function within cell I4, that is, the cell where you originally put the total sales of $480,000 in the budgeted income statement. 3. First, you type “=VLOOKUP” into the cell, and then click the button. This will bring up the “Function Arguments” window. 4. In the first box labeled “Lookup_value,” type “E28.” (This is telling Excel to find the number located in E28, which in this case is the original selling price per unit.) 5. In the second box, labeled “Table_array,” you highlight the complete data table K4:O24. This gives Excel the parameters of the data table. 6. In the third box, labeled “Col_index_num,” you type the column number in the table_array to which you’d like to reference cell E28. In this exercise, you would like to cross-reference “total sales” with the associated “sales price.” “Total sales” is located in the third column; therefore, you should type “3” in this box. This will tell Excel to input into cell I4 the amount of “total sales” from the table_array that matches E28’s sales price per unit. 7. In the fourth box, labeled “Range_lookup,” you type “false.” (When “false” is typed into this field, Excel looks for an exact match. If an exact match is not found the error value “#N/A” is returned. When “true” is typed in, Excel looks for the exact match, and if an exact match is not found an approximate match is returned.) 8. The formula in cell I4, after steps 5-7, should read as follows: =VLOOKUP(E29,K4:O24,3,FALSE) 9. Financial statements can be very long and detailed in nature. Your boss may want you to perform a sensitivity analysis, such as the one you have just created, but she does not want to view the whole financial statement. Rather, she wants to change the sales price per unit, and look right beside it to see the operating income associated with the changed sales price. This is where the function in F31 (shown above in step 3) comes into play. 10. In cell F31 you create another VLOOKUP function. Following the steps above, but with the following changes: a. The formula in cell F31 should be “=VLOOKUP(E28,K4:O24,5,FALSE)” b. The function in F31 is the same, with one exception: instead of Excel retrieving the amount of “total sales,” it will now retrieve the amount of “operating income.” This information is located in column 5 rather than column 3. Therefore, you type “5” in the field labeled “Col_index_num.” With this summary table you will now be able to use other common sensitivity analysis functions within Excel. 1. Mean 2. Median 3. 25th Percentile 4. 75th Percentile 5. Inter-quartile Range HLOOKUP Function—searches for a value in the top row of a table, and then returns a value in the same column from a row you specify in a data table. The HLOOKUP function is setup the same as the VLOOKUP function detailed above. The only different between the two is the way it references. This function references (i.e., “looks up”) data horizontally, while VLOOKUP searches vertically.
![VLOOKUP ([Score], A5:B10, 2)](http://s3.studylib.net/store/data/007008406_1-329b439ee1a3b5923ce08e77bb280c5d-300x300.png)


