Instructions - Erin Maloney
advertisement
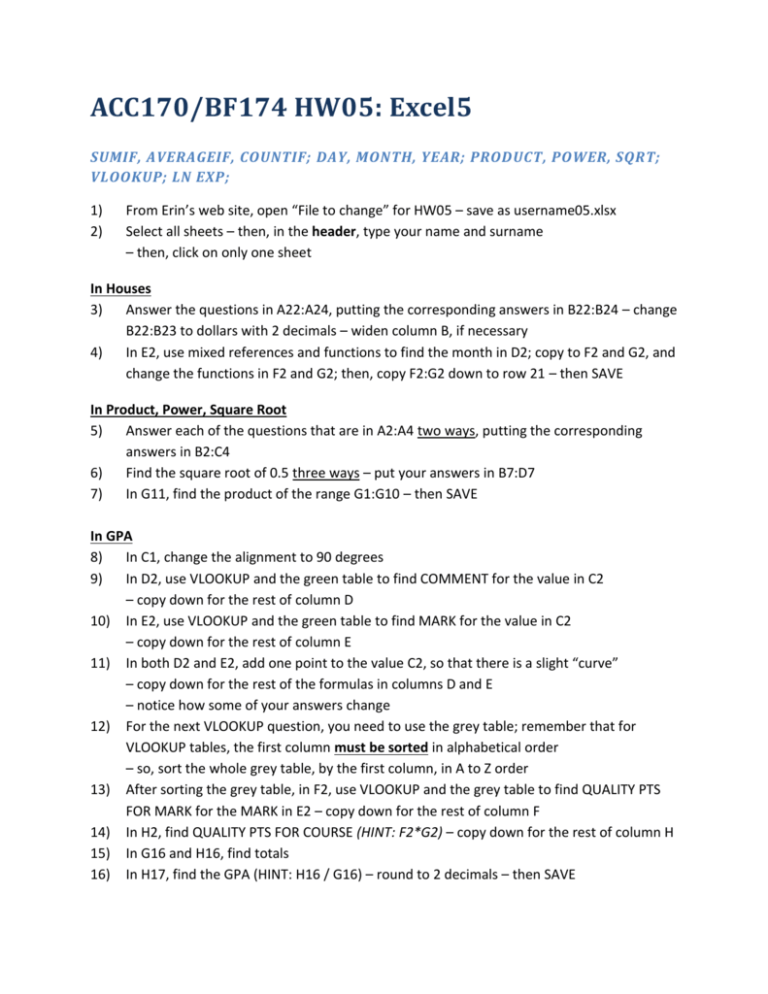
ACC170/BF174 HW05: Excel5 SUMIF, AVERAGEIF, COUNTIF; DAY, MONTH, YEAR; PRODUCT, POWER, SQRT; VLOOKUP; LN EXP; 1) 2) From Erin’s web site, open “File to change” for HW05 – save as username05.xlsx Select all sheets – then, in the header, type your name and surname – then, click on only one sheet In Houses 3) Answer the questions in A22:A24, putting the corresponding answers in B22:B24 – change B22:B23 to dollars with 2 decimals – widen column B, if necessary 4) In E2, use mixed references and functions to find the month in D2; copy to F2 and G2, and change the functions in F2 and G2; then, copy F2:G2 down to row 21 – then SAVE In Product, Power, Square Root 5) Answer each of the questions that are in A2:A4 two ways, putting the corresponding answers in B2:C4 6) Find the square root of 0.5 three ways – put your answers in B7:D7 7) In G11, find the product of the range G1:G10 – then SAVE In GPA 8) In C1, change the alignment to 90 degrees 9) In D2, use VLOOKUP and the green table to find COMMENT for the value in C2 – copy down for the rest of column D 10) In E2, use VLOOKUP and the green table to find MARK for the value in C2 – copy down for the rest of column E 11) In both D2 and E2, add one point to the value C2, so that there is a slight “curve” – copy down for the rest of the formulas in columns D and E – notice how some of your answers change 12) For the next VLOOKUP question, you need to use the grey table; remember that for VLOOKUP tables, the first column must be sorted in alphabetical order – so, sort the whole grey table, by the first column, in A to Z order 13) After sorting the grey table, in F2, use VLOOKUP and the grey table to find QUALITY PTS FOR MARK for the MARK in E2 – copy down for the rest of column F 14) In H2, find QUALITY PTS FOR COURSE (HINT: F2*G2) – copy down for the rest of column H 15) In G16 and H16, find totals 16) In H17, find the GPA (HINT: H16 / G16) – round to 2 decimals – then SAVE In LN, EXP 17) In B1, use a function to find the value "e", showing 5 decimals 18) In B2, find the natural log of 4 19) In B3, find the natural log of 5 20) In B4, find the exponential function of 4 21) In B5, find the exponential function of 5 22) In B6, find the natural log of the exponential function of 4 23) In B7, find the exponential function of the natural log of 5 24) Remove decimals for B6:B7 25) In E2:F7, find the exponential functions and natural logs of D2:D7; show answers with 3 decimal places (but F2 may show as a “hyphen” in place of a “0”); if necessary, widen columns 26) For the info in D1:F7, insert the first 2D Line chart; move it to start in G1; format the legend position to be “on top”, acting as a title, making it less wide and taller; remove the grey horizontal lines; make both the EXP line and the LN line: black and 5pt; make the EXP line be: square dot; make the numbers in both axes: bold, size 14; add a black, 5pt border 27) SAVE

![VLOOKUP ([Score], A5:B10, 2)](http://s3.studylib.net/store/data/007008406_1-329b439ee1a3b5923ce08e77bb280c5d-300x300.png)

![EXCEL TRAINING! IF STATEMENTS =IF([formula],[value if true](http://s3.studylib.net/store/data/009734727_1-749de7d2401dc15480a03835c4165ea0-300x300.png)
