nph12414-sup-0001-FigsS1-S8-TableS1
advertisement
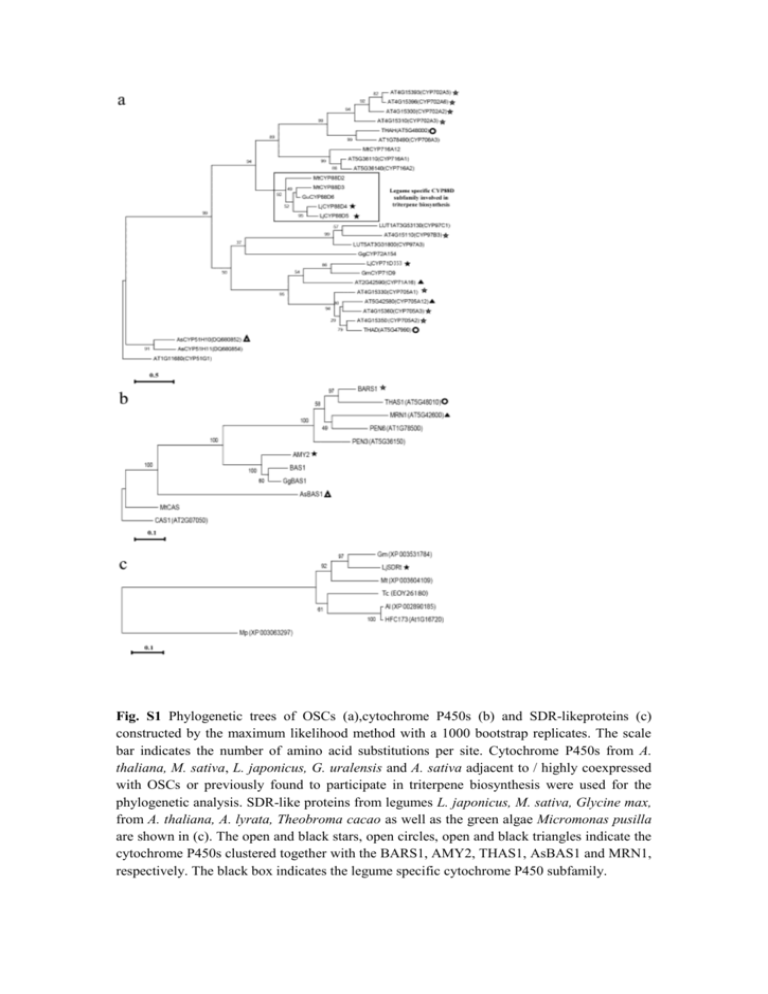
Fig. S1 Phylogenetic trees of OSCs (a),cytochrome P450s (b) and SDR-likeproteins (c) constructed by the maximum likelihood method with a 1000 bootstrap replicates. The scale bar indicates the number of amino acid substitutions per site. Cytochrome P450s from A. thaliana, M. sativa, L. japonicus, G. uralensis and A. sativa adjacent to / highly coexpressed with OSCs or previously found to participate in triterpene biosynthesis were used for the phylogenetic analysis. SDR-like proteins from legumes L. japonicus, M. sativa, Glycine max, from A. thaliana, A. lyrata, Theobroma cacao as well as the green algae Micromonas pusilla are shown in (c). The open and black stars, open circles, open and black triangles indicate the cytochrome P450s clustered together with the BARS1, AMY2, THAS1, AsBAS1 and MRN1, respectively. The black box indicates the legume specific cytochrome P450 subfamily. Fig. S2 Gene transcript levels of AMY2, LjCYP88D5 and LjCYP71D353, constituting the AMY2 gene cluster, expressed relative to the level of each gene expression in seven-days-old root tissues in both uninoculated (a) and inoculated with M. loti (b) L. japonicus roots, leaves and nodules. Uninoculated and inoculated plants are of the same age at the stages of 7d old (days old)-7dpi (days post infection), 14d old-14 dpi and 28d old-28 dpi, respectively, but are analysed in different real-time PCR reactions. Total RNA was reverse transcribed, the concentration was normalized between samples and then real-time PCR was performed. Relative gene expression was measured with respect to UBQ transcripts. Mean values ± SE are shown (n=3). Fig. S3 In situ hybridization of AMY2 (a, b, c, d), LjCYP71D353 (e, f, g, h) and LjCYP88D5 (i, j, k, l) gene transcripts in mature 28dpi and developing 14dpi L. japonicus nodules. Eight μm thin sections were hybridized with DIG-11rUTR labeled anti-sense RNA in vitro transcribed from of PCR products of AMY2, LjCYP71D and LjCYP88D5. Hybridization signal was visualized using an alkaline phosphate reaction product (blue-purple colour). For all genes in mature and developing nodules the hybridization signal was detected in the inner cortex (ic) and in vascular bundles (vb) (visible in panel K) and also in uninfected cells (not shown). The hybridization signal was not detected in the infected cells of central tissue (ct) or outer cortex parenchyma (oc). As a negative control, thin sections were hybridized with DIG11rUTR labeled sense RNA in vitro transcribed from PCR products of AMY2, LjCUP71D and LjCYP88D5. Scale bar 100μm. Fig. S4 Gene transcript levels of LjSDRt, present in the AMY2 gene cluster, were detected in both uninoculated (a) and inoculated with M. loti (b) L. japonicus roots, leaves and nodules. Uninoculated and inoculated plants are of the same age at the stages of 7d old (days old)-7dpi (days post infection), 14d old-14 dpi and 28d old-28 dpi, respectively. Total RNA was reverse transcribed, the concentration was normalized between samples and then real-time PCR was performed. Relative gene expression was measured with respect to UBQ transcripts. Mean values ± SD are shown (n=3). Gene transcript levels expressed relative to the level of gene expression in seven-days-old root tissues in shown in uninoculated (c) and inoculated with M. loti (d) L. japonicus roots, leaves and nodules. Fig. S5 Gene transcript levels of AMY2, LjCYP88D5 and LjCYP71D353 in root tissues treated with salt stress for 7 d. Total RNA from 14-d-old roots (20–50 seedlings per treatment) was reverse transcribed, the concentration was normalized between samples and then real-time PCR was performed. Relative gene expression was measured with respect to UBQ transcripts. Data from a single representative experiment are presented, experimental repeats yielded similar results. Fig. S6 Main fragments in the mass spectrometry fragmentation patterns of the TMSderivatives of dihydrolupeol (a), 20-hydroxy-lupeol (b) and 20-hydroxy-betulinic acid (c). Fig. S7 GC-MS analysis of saponified Nicotiana benthamiana leaf extracts after transient expression of AsbAS1, LjCYP71D353 and/or LjCYP88D5. Arrows indicate the β-amyrin peak. Fig. S8 Syntenic analysis of multiple genomic regions encompassing OSC genes that participate in metabolic gene clusters in L. japonicus (genes described in this study) and A. thaliana (thalianol and marneral gene clusters), using the Gevo algorithm. Cytochrome P450 genes are indicated with red squares and OSC genes with yellow exons. Table S1 Primers used for experimental procedures (restriction sites are in bold) Procedure Target Primer Sequence In situ hybridization AMY2 AMY2isF AMY2isR LjCYP88D5isF LjCYP88D5R LjCYP71DisF LjCYP71DisR AMY2-2F 5’-GGACTCGAGTCTAGACAACAGGATATTACTGGAGTATACG -3’ 5’-TTAGGTACCAAGCTTGAACTTGTTTGATTATTTTATTTGCATG -3’ 5’-TGGTCGGAAACTGGAGGATGG-3’ 5’-AGTCTGCGAGGACACTCTTTAACC-3’ 5’-AACGCTGGCTACTTGTGATTAG-3’ 5’-CCTCAACATACCCTCTGCTACC-3’ 5’-GGACTCGAG TCTAGACAACAGGATATTACTGGAGTATACG-3’ AMY2-2R AMY2-3F AMY2-3R LjCYP88D5-1F LjCYP88D5-1R LjCYP88D5-3F LjCYP88D5-3R UBQF UBQR 35S-F 5’-TTAGGTACC AAGCTTGAACTTGTTTGATTATTTTATTTGCATG-3’ 5’-GGACTCGAGTCTAGAGTACAGAAATAATTTTTTTACAACGATGG-3’ 5’-AAGGTACCAAGCTTGCAACAAACCGACACTAAATAC-3’ 5’-AAGACTCGAGTCTAGATGGTCGGAAACTGGAGGATGG-3’ 5’-TTAGGTACCAAGCTTAAGTCTGCGAGGACACTCTTACC-3’ 5’-CCGACTCGAGTCTAGAACCCACACATCTTGAATAAAGC-3’ 5’-AAAGGTACCAAGCTTTATTGGCACACCGCAACG-3’ 5’-ATGCAGATCTTTTGTGAAGAC-3’ 5’-ACCACCACGGAAGACGGAG-3’ 5’-TGTGATAACATGGTGGAGCA-3’ 35S-R Hyg-F Hyg-R UBQrtF UBQrtR AMY2rtF 5’-GGTGATTTCAGCGTGTCCTC-3’ 5’-GACCAATGCGGAGCATATACG-3’ 5’-CAGCTTCGATGTAGGAGGGC-3’ 5’-TTCACCTTGTGCTCCGTCTTC-3’ 5’-AACAACAGCACACACAGCCAATCC-3’ 5’-GCAGTTTAACTTGTAAAGATAGC-3’ AMY2rtR LjCYP88D5rtF LjCYP88D5rtR LjCYP71DrtF LjCYP71DrtR LjCYP88D5Fl-F 5’-GGCAACAAACCGACACTAAATAC-3’ 5’- TAGTGTTCTGGAAGTCAATGATG-3’ 5’- AGATGTGTGGGTGTTGTGTAAG-3’ 5’- ACATTAAAGCCGTTCTTCAGGAC-3’ 5’- CCTCAACATACCCTCTGCTACC-3’ 5’-ATGGAACTATACTGGGCTTGG-3’ LjCYP88D5Fl-R LjCYP71DFl-F LjCYP71DFl-R LjAMY2FlBstBi 5’-TAATTACATGAAACCTTTATCACC-3’ 5’-TGCCCTTTTGCTAATGATGG-3’ 5’-TTATTCAACAGAAACAGGATTGTAAG-3’ 5’-AATATTCGAACATGTGGAAGCTGAAGGTAG-3’ LjAMY2Fl-StuI LjCYP88D5FlBsu36i LjCYP88D5FlStuI LjCYP71DFlBsu36i LjCYP71DFlStuI LjCYP71D-Bs-F LjCYP71D-Bs-R LjSDRt-Bs-F LjSDRt-Bs-R 5’-TTATAGGCCTTGCACACAGCTATCTTTACAAG-3’ 5’-TACACCTGAGGAATGGAACTATACTGGGCTTGG-3’ LjCYP88D5 LjCYP71D Plant transformation AMY2 AMY2 LjCYP88D5 LjCYP88D5 RT-PCR Ubiquitin 35S promoter Hygromycin Q-PCR Ubiquitin AMY2 LjCYP88D5 LjCYP71D Cloning of full-length genes LjCYP88D5 LjCYP71D Expression of heterologous proteins in N. benthamiana AMY2 LjCYP88D5 LjCYP71D Bisulfite sequencing LjCYP71D LjSDRt 5’-TTAGAGGCCTTTAATTACATGAAACCTTTATCACC-3’ 5’-TACACCTGAGGTGCCCTTTTGCTAATGATGG-3’ 5’-TTATAGGCCTTTTTATTCAACAGAAACAGGATTGTAAG-3’ 5’-TAATCACTGCTCTCCCTCCC-3’ 5’-CAACACCTCTTTGGCAATTTC-3’ 5’- CCCGAAAACTACTTTTTGCA-3’ 5’-CGATTAGTATTCGCTTAAACC-3’

