Task: How Much for How Much - Cost Benefit of a Higher Education
advertisement
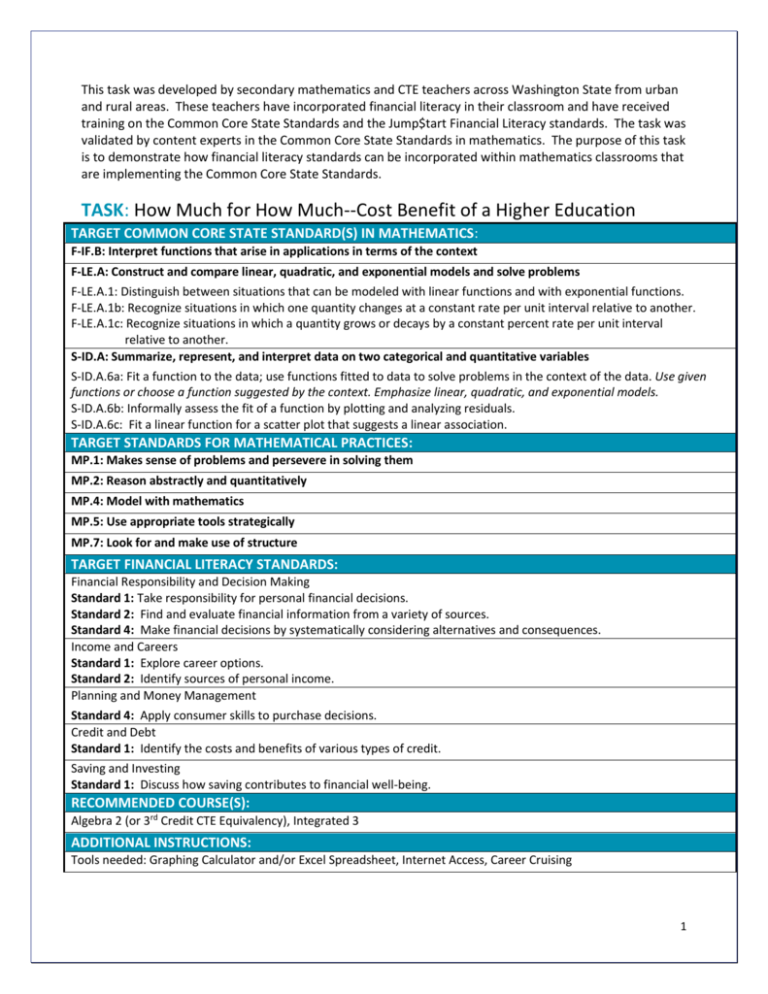
This task was developed by secondary mathematics and CTE teachers across Washington State from urban and rural areas. These teachers have incorporated financial literacy in their classroom and have received training on the Common Core State Standards and the Jump$tart Financial Literacy standards. The task was validated by content experts in the Common Core State Standards in mathematics. The purpose of this task is to demonstrate how financial literacy standards can be incorporated within mathematics classrooms that are implementing the Common Core State Standards. TASK: How Much for How Much--Cost Benefit of a Higher Education TARGET COMMON CORE STATE STANDARD(S) IN MATHEMATICS: F-IF.B: Interpret functions that arise in applications in terms of the context F-LE.A: Construct and compare linear, quadratic, and exponential models and solve problems F-LE.A.1: Distinguish between situations that can be modeled with linear functions and with exponential functions. F-LE.A.1b: Recognize situations in which one quantity changes at a constant rate per unit interval relative to another. F-LE.A.1c: Recognize situations in which a quantity grows or decays by a constant percent rate per unit interval relative to another. S-ID.A: Summarize, represent, and interpret data on two categorical and quantitative variables S-ID.A.6a: Fit a function to the data; use functions fitted to data to solve problems in the context of the data. Use given functions or choose a function suggested by the context. Emphasize linear, quadratic, and exponential models. S-ID.A.6b: Informally assess the fit of a function by plotting and analyzing residuals. S-ID.A.6c: Fit a linear function for a scatter plot that suggests a linear association. TARGET STANDARDS FOR MATHEMATICAL PRACTICES: MP.1: Makes sense of problems and persevere in solving them MP.2: Reason abstractly and quantitatively MP.4: Model with mathematics MP.5: Use appropriate tools strategically MP.7: Look for and make use of structure TARGET FINANCIAL LITERACY STANDARDS: Financial Responsibility and Decision Making Standard 1: Take responsibility for personal financial decisions. Standard 2: Find and evaluate financial information from a variety of sources. Standard 4: Make financial decisions by systematically considering alternatives and consequences. Income and Careers Standard 1: Explore career options. Standard 2: Identify sources of personal income. Planning and Money Management Standard 4: Apply consumer skills to purchase decisions. Credit and Debt Standard 1: Identify the costs and benefits of various types of credit. Saving and Investing Standard 1: Discuss how saving contributes to financial well-being. RECOMMENDED COURSE(S): Algebra 2 (or 3rd Credit CTE Equivalency), Integrated 3 ADDITIONAL INSTRUCTIONS: Tools needed: Graphing Calculator and/or Excel Spreadsheet, Internet Access, Career Cruising 1 About the Common Core State Standards in Mathematics The Common Core State Standards (CCSS) is a state developed set of standards that represent a coherent progression of learning expectations in English language arts and mathematics. These standards are designed to establish a set of shared goals and expectations for what students should understand and be able to do in grades K–12 in order to be prepared for success in college and the workplace. Forty-six states have now adopted these shared standards. The CCSS for mathematics highlight three major shifts around Focus, Coherence and Rigor. For more information: http://www.k12.wa.us/CoreStandards/Mathematics/default.aspx About the Jump$tart Financial Literacy Standards The National Standards in K–12 Personal Finance Education, created and maintained by the Jump$tart Coalition® for Personal Financial Literacy, delineate the personal finance knowledge and skills that K–12 students should possess. The Jump$tart Coalition intends the National Standards in K–12 Personal Finance Education to serve as a model. As such, the National Standards represent the framework of an ideal personal finance curriculum, portions of which might not be appropriate for individual instructors and students. The Coalition leaves it up to various stakeholders to decide how to address the topics in the National Standards. http://jumpstart.org/national-standards.html Key Terms Opportunity Cost Inflation Future Value In-State Tuition Out of State Tuition Cost/benefit ratio 2 The Task Introduction: This is a multi-day unit. Students will participate in a career exploration activity and choose two possible higher education opportunities to investigate and then compare and contrast the two in terms of future value of their money and the cost/benefit ratio of going to college. Some essential questions to keep in mind as students work through the project: What amount of education do I need to pursue the career I really want? How much will my education really cost when I factor in tuition and other fees? What is my earning potential after college compared to my earning potential if I don’t go to college? What will the cost of my college education be if I delay going for 10 years? What are the financial ramifications I can predict for myself with regards to retirement if I don’t increase my earning potential? Part I - Choosing a College/Career Path: Have students read the article, “Digging Deeper into the Relationship between Education and Income” at http://www.educationcompass.com/relationship-betweeneducation-and-income. Have students go to a career exploration website or fill out a paper career exploration survey. They will choose two careers to investigate the associated educational costs. Students should choose one career that requires 4 years of college or more and one that requires less than 4 years of college, or an apprenticeship. Students should choose two possible schools or colleges that provide education in their career choices. Students will determine if each school is a public or private school and is in-state or out-ofstate. One school should be four years or more and one should be less than four years or an apprenticeship program. 3 Part 2 - The Math: Projected College Costs Students will gather and graph historical college costs for each of their chosen schools in order to determine a function that best models the data. 1. Using http://chronicle.com/article/Interactive-Tool-TuitionOver/125043/, gather and graph historical college costs for both of your chosen schools. Scroll over each data point to see the tuition amount for that year. See screen shot below. 2. Predict the type of function that best models the 1999-2010 data for each of your chosen schools, focusing on linear, quadratic, or exponential functions. a. School A: (4-year college) b. School B: (2-year college/technical program) 3. Using either a spreadsheet program or graphing calculator regression, analyze the data and determine the regression equation that will best predict future tuition. a. School A: (4-year college) b. School B: (2-year college/technical program) 4. Use the data to explain why the regression equations from question #3 best fit the data for School A and B. 5. a. Using the regression equation from question #3, what will the cost of your first year of education be if you attend college immediately after your high school graduation? i. School A: ii. School B: 4 b. Using the regression equation from question #3, what will be the cost of your first year of education if you delay your schooling for 10 years? i. School A: ii. School B: 6. For the 4-year college, calculate the TOTAL amount you will pay in tuition at the end of 4 years, assuming you begin school immediately after high school graduation. Use your regression equation to calculate the cost for all 4 years. a. Total tuition:____________________ Part 3 – Total Cost of College: Paying it Back With Interest! Investigate the true cost of education if you have to borrow money to complete your education. Use the following formula to find the monthly payment for your college loan. Monthly payment: 𝑃= 𝑟 12 𝑟 −𝑛 1−(1+ ) 12 𝑃𝑣∗ Where: P= Monthly Payment Pv = Present Value (beginning value or amount of loan) r= interest rate (as a decimal) n= # of interest periods for overall time period (i.e., interest periods per year * number of years. 7. Compare the overall cost of repaying your college loan at different interest rates. Find the total cost of education, with interest, based on a 10 year repayment time with monthly payments. Use the TOTAL TUTION amount from question #6 and the formula above to calculate your monthly payments to determine the total interest you will pay and total cost of tuition for each given interest rate. 5 a. College Total Tuition: __________________________ (from question #6) i. ii. iii. iv. Total Total Total Total Interest Paid at 3.5%: _________________ Tuition at 3.5%: _____ Interest Paid at 6.5%:__________________ Tuition 6.5%: _________ 8. Using an online amortization calculator (such as www.financialcalculator.com), determine how much money you will save in interest if you make an additional $100 monthly payment for both Loan A and B. i. Interest savings for School A: ii. Interest savings for School B: Part 4 – Earning Potential Students will use the following table to determine their lifetime earning potential. Assume you will retire when you are 65 years old. Use the table at http://www.acinet.org/finaidadvisor/earnings.aspx (or similar website that compares educational attainment to average income) to determine your average annual wages depending upon the amount of education you chose. Consider how many years you can work before retirement (at age 65) after you finish your education requirements. Part 5 – Decision Making Students will choose a career using data to support their decision. Have students develop a decision-making process, such as a cost/benefit ratio. They should discuss the non-financial considerations and opportunity costs associated with making choices, such as exchanging daily enjoyment of a job you really love for high wages of a job you may not love as much. Some 6 interesting relationships involving education levels are included in the brochure at http://trends.collegeboard.org/sites/default/files/brief/educationpays-2010-in-brief.pdf Students will use their cost/benefit ratio to justify your decision. Possible Solutions 1. Example of 4-year college and 2-year college data. Answers below are based on this data. 2. Predict the type of function that best models the 1999-2010 data for each of your chosen schools, focusing on linear, quadratic, or exponential functions. a. School A (4-year college) ____ _______ Student responses may vary b. School B (2-year college/technical program) Student responses may vary 7 3. Using either a spreadsheet program or graphing calculator regression, analyze the data and determine the regression equation that will best predict future tuition. a. School A (4-year college) _______ Y = 18732.1398(1.0413^X) b. School B (2-year college/technical program) __Y = 2175.002(1.0427^X) 4. Use the data to explain why the regression equations from question #3 best fits the data for School A and B. 5. a. Using the regression equation from question #3, what will the cost of your first year of education be if you attend college immediately after your high school graduation? i. School A (Assuming they will begin college in 2015 or x=16) __$35,793.26 ii. School B (Assuming they will begin college in 2015 or x=16) ____$42,46.29 b. Using the regression equation from question #3, what will be the cost of your first year of education if you delay your schooling for 10 years? i. School A (Assuming they will begin college in 2025 or x=26) ___ $53,648.79 ii. School B (Assuming they will begin college in 2025 or x=26) $6450.65 6. For the 4-year college, calculate the TOTAL amount you will pay in tuition at the end of 4 years, assuming you begin school immediately after high school graduation. Use your regression equation to calculate the cost for all 4 years. a. Total tuition:___$152,290 7. Compare the overall cost of repaying your college loan at different interest rates. Find the total cost of education, with interest, based on a 10 year repayment time with monthly payments. Use the TOTAL TUTION amount from question #6 and the formula above to calculate your monthly payments to determine the total interest you will pay and total cost of tuition for each given interest rate. a. College Total Tuition:___________________$152,290 (from question #6) i. Total Interest Paid at 3.5% _________$28,422 ii. Total Tuition at 3.5% _______ $180,712 iii. Total Interest Paid at 6.5% _________$55,217 iv. Total Tuition 6.5% __________ $207,507 8. Using an online amortization calculator (such as www.financialcalculator.com ), determine how much money you will save in interest if you make an additional $100 monthly payment for both Loan A and B. i. Interest savings for School A __ $26,242 a savings of $2180 ii. Interest savings for School B __ $50,738 a savings of $4479 8 Possible Extensions 1. Savings potential – “Tale of 2 Savers”. Two individuals invest differently. Investor A invests $3000 per year for 10 years at an interest rate of 10%. The investor stops making yearly deposits but leaves her money in the account for an additional 30 years. The money will continue to grow at the 10% rate. Investor B saves $3000 per year for 30 years at an interest rate at 10%. How much will each have at the end of 40 years? 2. Inflation – discuss the effects of inflation on the purchasing power of future earnings. 9


