review each of the following scenarios and indicate which statistical
advertisement
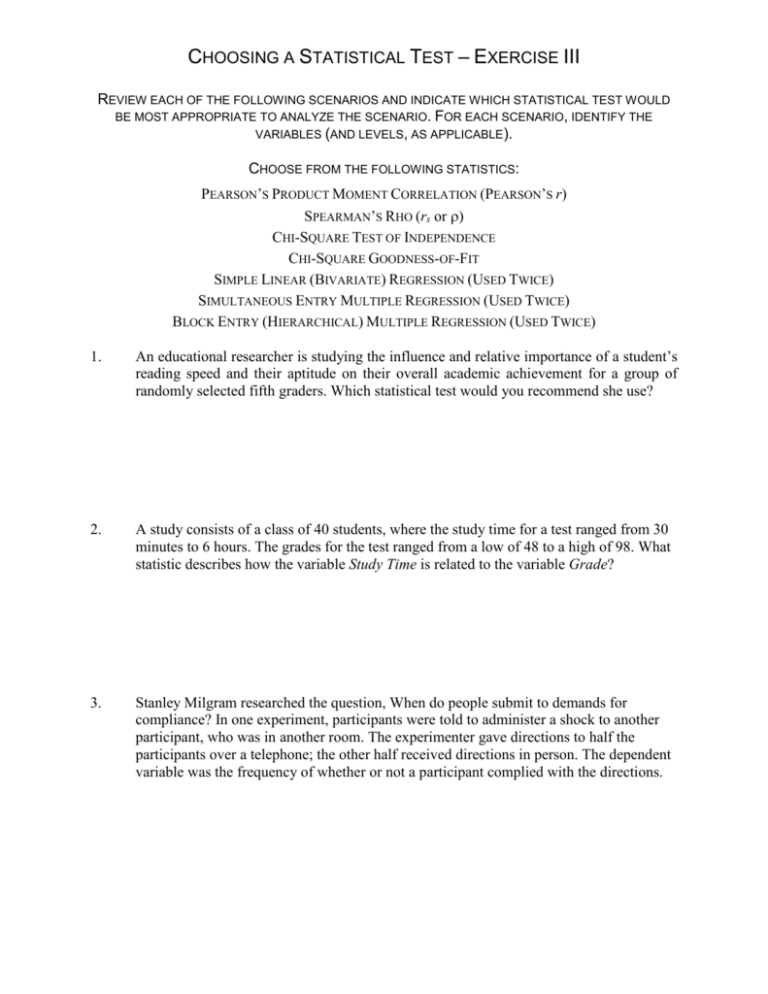
CHOOSING A STATISTICAL TEST – EXERCISE III REVIEW EACH OF THE FOLLOWING SCENARIOS AND INDICATE WHICH STATISTICAL TEST WOULD BE MOST APPROPRIATE TO ANALYZE THE SCENARIO. FOR EACH SCENARIO, IDENTIFY THE VARIABLES (AND LEVELS, AS APPLICABLE). CHOOSE FROM THE FOLLOWING STATISTICS: PEARSON’S PRODUCT MOMENT CORRELATION (PEARSON’S r) SPEARMAN’S RHO (rs or ) CHI-SQUARE TEST OF INDEPENDENCE CHI-SQUARE GOODNESS-OF-FIT SIMPLE LINEAR (BIVARIATE) REGRESSION (USED TWICE) SIMULTANEOUS ENTRY MULTIPLE REGRESSION (USED TWICE) BLOCK ENTRY (HIERARCHICAL) MULTIPLE REGRESSION (USED TWICE) 1. An educational researcher is studying the influence and relative importance of a student’s reading speed and their aptitude on their overall academic achievement for a group of randomly selected fifth graders. Which statistical test would you recommend she use? 2. A study consists of a class of 40 students, where the study time for a test ranged from 30 minutes to 6 hours. The grades for the test ranged from a low of 48 to a high of 98. What statistic describes how the variable Study Time is related to the variable Grade? 3. Stanley Milgram researched the question, When do people submit to demands for compliance? In one experiment, participants were told to administer a shock to another participant, who was in another room. The experimenter gave directions to half the participants over a telephone; the other half received directions in person. The dependent variable was the frequency of whether or not a participant complied with the directions. 4. A researcher is interested in testing the predictive influence of a student’s college success (as measured by their academic majors GPA) as a function of a set of high school measures (GPA and ACT) and a set of college measures (Standardized Test and Freshman GPA). The study is designed to examine the combined effect and the additive effect of the college measures over and above the high school measures. 5. A group of athletic trainers use a test of physical conditioning that is very comprehensive, but has the disadvantage that its administration is long and complex. A researcher develops a shorter, simpler test of physical conditioning and administers both tests to a group of young adult athletes. The intention is to use the shorter test as a substitute for the longer, more complex test, but that will depend on how good a predictor the scores on the short test are of the scores on the long test. Which statistical test would be used to answer whether the short test can be substituted? 6. As part of a class project, two students administered a test to undergraduate seniors which ranked their creativity. They also obtained each student’s rank in class. In what way could the two students determine the degree of relationship between the two variables? 7. Tuition at a local university has gone up each of the past five years. The university reports that it is a function of the rate of inflation. How can you predict what the tuition will be in twenty years when your child enrolls? CHOOSING A STATISTIC III PAGE 2 8. Research has shown (indicated) that an individuals performance (success, as measured by their final grade) in the ABC Program is a function of what they bring into the program training (pre-ability measures) and what they learn while in the program training (acquired ability measures). You have been asked to investigate whether individuals’ acquired abilities offer significant additional predictive power beyond that contributed by the individuals’ pre-abilities. What statistical test would you use for this study? 9. Suppose a theory predicts that the proportion of people who participate in a rather difficult exercise will drop by one-half each time the exercise is repeated. When the data are gathered, 100 people participated on the first day. On each of the next three occasions, fewer and fewer people participated. What statistical test could be used to arrive at a judgment about the theory? 10. Tuition at a local university has gone up each of the past five years. The university reports that it is a function of the rate of inflation, the cost of maintaining the university, and increases in staff and faculty salaries. How can you predict what the tuition will be in twenty years when your child enrolls? CHOOSING A STATISTIC III PAGE 3

