docx - MIT Haystack Observatory
advertisement
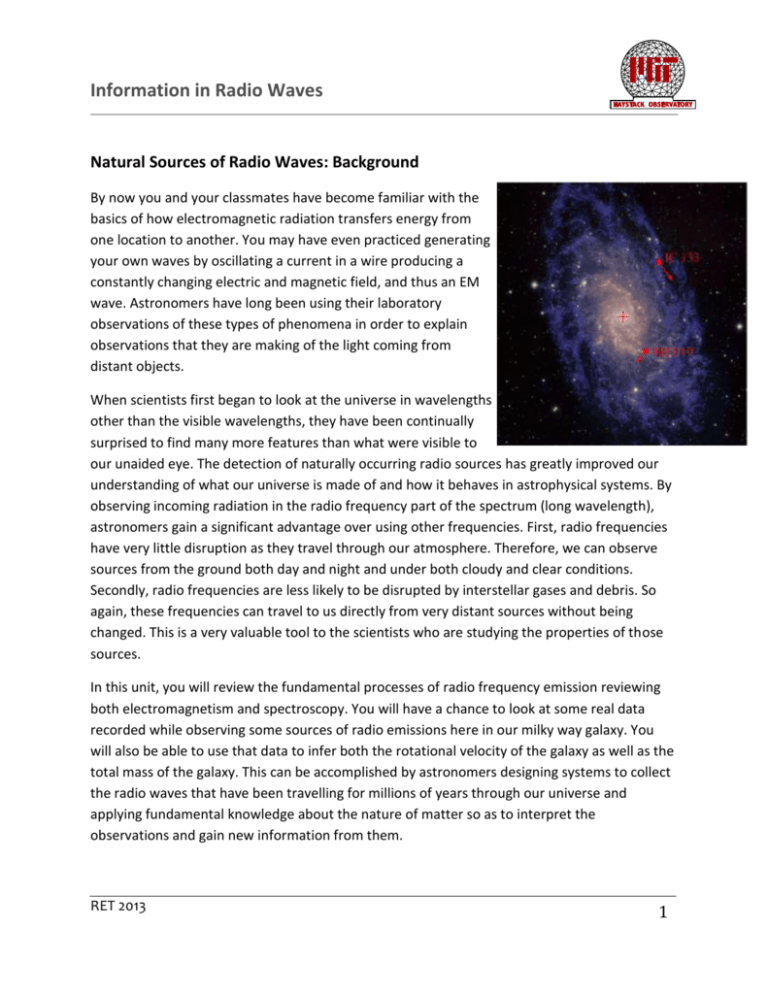
Information in Radio Waves Natural Sources of Radio Waves: Background By now you and your classmates have become familiar with the basics of how electromagnetic radiation transfers energy from one location to another. You may have even practiced generating your own waves by oscillating a current in a wire producing a constantly changing electric and magnetic field, and thus an EM wave. Astronomers have long been using their laboratory observations of these types of phenomena in order to explain observations that they are making of the light coming from distant objects. When scientists first began to look at the universe in wavelengths other than the visible wavelengths, they have been continually surprised to find many more features than what were visible to our unaided eye. The detection of naturally occurring radio sources has greatly improved our understanding of what our universe is made of and how it behaves in astrophysical systems. By observing incoming radiation in the radio frequency part of the spectrum (long wavelength), astronomers gain a significant advantage over using other frequencies. First, radio frequencies have very little disruption as they travel through our atmosphere. Therefore, we can observe sources from the ground both day and night and under both cloudy and clear conditions. Secondly, radio frequencies are less likely to be disrupted by interstellar gases and debris. So again, these frequencies can travel to us directly from very distant sources without being changed. This is a very valuable tool to the scientists who are studying the properties of those sources. In this unit, you will review the fundamental processes of radio frequency emission reviewing both electromagnetism and spectroscopy. You will have a chance to look at some real data recorded while observing some sources of radio emissions here in our milky way galaxy. You will also be able to use that data to infer both the rotational velocity of the galaxy as well as the total mass of the galaxy. This can be accomplished by astronomers designing systems to collect the radio waves that have been travelling for millions of years through our universe and applying fundamental knowledge about the nature of matter so as to interpret the observations and gain new information from them. RET 2013 1 Information in Radio Waves Natural Sources of Radio Waves: Teacher Guide Enrichment Resources https://www.cfa.harvard.edu/~lwoolsey/zeeman.html - Online tutorial on the Zeeman effect http://phet.colorado.edu/en/simulation/hydrogen-atom - Online simulation of absorption/emission spectra. https://www.youtube.com/watch?feature=player_embedded&v=BvjeP3SfD1g – Video Why don’t we see green starts NGSS Performance Expectations HS-PS3-5 HS-PS4-4 Develop and use a model of two objects interacting through electric or magnetic fields to illustrate the forces between objects and the changes in energy of the objects due to the interaction. Evaluate the validity and reliability of claims in published materials of the effects that different frequencies of electromagnetic radiation have when absorbed by matter. Unit Overview In this unit we are trying to answer the essential question: What information can we get from observations of radio waves emitted by natural sources. Unit plan: Starter activity and pre-test Lecture 1:Thermal Radiation Lecture 2: Spectral Line Emission Activity: Hydrogen emission lines using gas tubes and spectrometers Lecture 3: Non-thermal Emission Activity: Windows in the atmosphere: Why is Radio Astronomy so Useful Assessment References Woolsey, Lauren. "Investigating the Zeeman Effect." Course Project in Ay203b at Harvard Center for Astrophysics (2013): 1-7. Web. <https://www.cfa.harvard.edu/~lwoolsey/ay201b_ZeemanEffect.pdf>. Woolsey, Laura. "The Zeeman Effect in the ISM." Investigating the Zeeman Effect. Apr. 2013. Web. 21 July 2014. <https://www.cfa.harvard.edu/~lwoolsey/zeeman.html>. RET 2013 2 Information in Radio Waves RET 2013 3 Information in Radio Waves Natural Sources of Radio: Pre-assessment Part 1: Label these parts of the electromagnetic (EM) spectrum: Label each line with the correct type of EM radiation Visible light Ultraviolet Radio waves Gama Rays Microwave Infrared Which wavelengths are going to have the highest energy? Which will have the lowest? Which are harmful to humans? RET 2013 4 Information in Radio Waves Part 2: Discuss and build consensus on responses to the following questions. To the right you see a standard Bohr model of an atom. The blue circles represent electrons at various energy states around the central region of the atom. Does it take energy for 1 electron to change its position on an energy level outside the nucleus? Explain. The 3 colored lines represent 3 photons of visible light. Which one would have more energy ? Why? Does the emission of EM radiation by energy transitions of electrons only happen for energies corresponding to the visible wavelengths of light? RET 2013 5 Information in Radio Waves Natural Sources of Radio: Starter Activity Materials: Index cards, labels for stairs or bleachers Procedures: Bring the students to a stairwell or set of bleachers somewhere in your school. Alternatively you can set up a series of 4 distances from a baseline (3-4 meters apart) and mark them with masking tape. The starting position is analogous to the ground state of an atom. Each level above (or further from) the ground state represents an electron orbital in a higher energy state. Label or designate 4 different energy states on the bleachers. Activity1: modelling absorption and emission Prepare a deck of index cards with equal numbers of the different energy levels 1-4 Have each student draw a card randomly and when they see the number on the card they have to occupy that energy level and return. After all students have run through once, ask the question: Which level required the more energy to get to? Reflection questions: Which action by the electron is analogous to atomic absorption and which is analogous to emission? Activity 2: Remotely sensing the transitions If you haven’t already done activity 1, prepare a deck of index cards with equal numbers of the different energy levels 1-4. Have the class turn their backs to the model atom and the electron transitioning from the ground state. One student at a time is a volunteer electron who will draw a card and transition to and from an energy state. The class should listen carefully and try to determine from the sound that the ‘excited electron’ makes. Students should all guess which level was occupied after each student takes a turn. Reflection Questions: What form of remote observations were made (what senses did you use) to determine the level that the ‘excited student’ transitioned to. What evidences did you use? If you can describe how differences in energy level corresponded to differences in energy that you sensed. For example, did loudness (amplitude of sound waves) RET 2013 6 Information in Radio Waves play a role, Did the number and type of sounds help you? Imagine you are now watching these transitions from outside the room through a window. A flashlight is placed at each energy level and the electron is instructed to transition up to the energy level and back down again only on the way back down the have to turn the flashlight on and point it at the window. Would you be able to tell that the electron was transitioning from one energy level to the ground state? What if each flashlight was a different color? Would that make it easier to pinpoint which transition the electron was making. See Quantum Mechanics is easy. The different colors of light emitted by each transition helps us know what type of atom or molecule is doing the absorption and emission. Vocabulary: atomic transition, absorption, emission, energy level, remote sensing RET 2013 7
