er3298-sup-0001-supinfo
advertisement
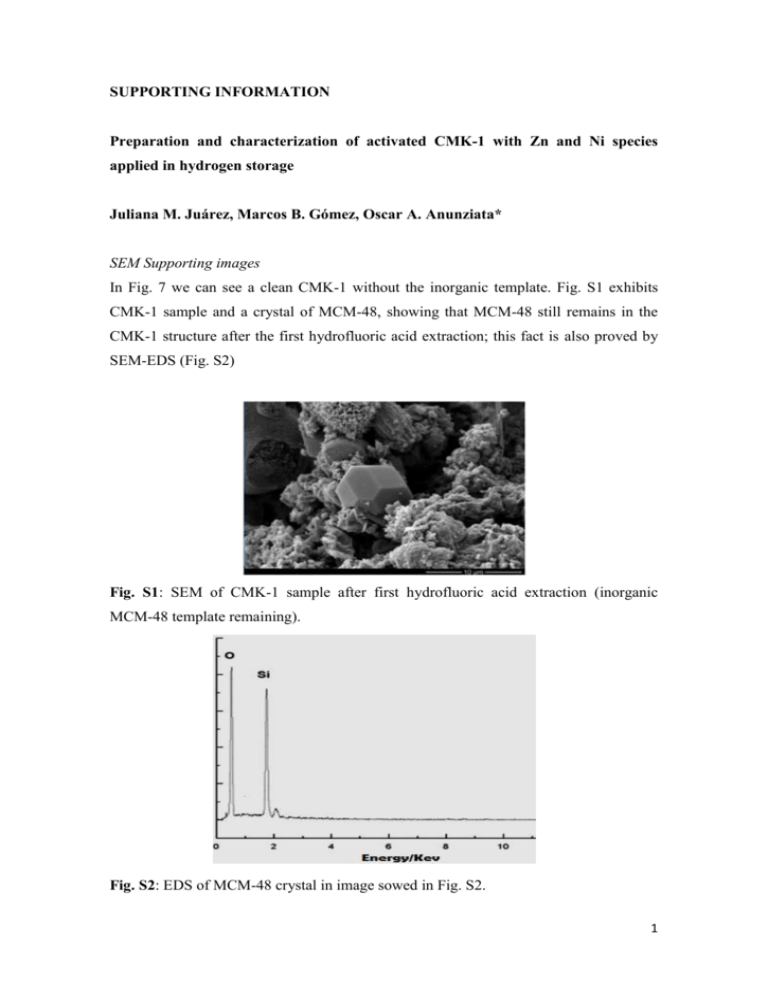
SUPPORTING INFORMATION Preparation and characterization of activated CMK-1 with Zn and Ni species applied in hydrogen storage Juliana M. Juárez, Marcos B. Gómez, Oscar A. Anunziata* SEM Supporting images In Fig. 7 we can see a clean CMK-1 without the inorganic template. Fig. S1 exhibits CMK-1 sample and a crystal of MCM-48, showing that MCM-48 still remains in the CMK-1 structure after the first hydrofluoric acid extraction; this fact is also proved by SEM-EDS (Fig. S2) B Fig. S1: SEM of CMK-1 sample after first hydrofluoric acid extraction (inorganic MCM-48 template remaining). Fig. S2: EDS of MCM-48 crystal in image sowed in Fig. S2. 1 FTIR spectra show characteristic bands of MCM-48 that indicate great crystallinity of material (see Fig. S3 in Supporting information). The peak at around 1638 cm-1 corresponds to the bending mode of O–H of water. The peaks around 1288 and 1180 cm-1 are attributed to the asymmetric stretching of Si–O–Si groups. The band at 806 cm -1 and a broad signal appears at 580 cm-1 is assigned to the symmetric stretching modes of Si–O–Si groups. The peak at 963-967 cm-1 is attributed to the presence of defective Si–OH groups while the adsorption band at 458 cm-1 is due to Si–O–Si bending vibration. In carbon CMK-1 and metal/CMK-1, these bands disappeared because the siliceous material was eliminated in the process of carbon synthesis. MCM-48 CMK-1 1180 Zn-CMK-1 1228 Ni-CMK-1 458 Absorbance (a.u.) 1638 806 965 2000 1500 1000 500 Wavenumber (cm-1) Fig. S3. FTIR spectra from 2000 to 400 cm-1 of MCM-48, CMK-1 and metal-containing CMK-1. The experimental data obtained of hydrogen storage on non-activated and activated (before and after hydrogen treatment) for Zn-CMK-1 and Ni-CMK-1 materials (see Fig. S4), indicate that the hydrogen storage of non-activated are lower than activated materials. 2 2.0 3.5 1.0 0.8 0.6 0.4 0.2 0.0 0.0 0.2 0.4 0.6 Presure (bar) 0.8 1.0 1.5 Adsorption CMK-1 Adsorption ZnO-CMK-1 1.0 Desorption CMK-1 Desorption ZnO-CMK-1 0.5 0.0 H adsorption capacity (wt. %) 2 2.5 1.2 0 2 4 6 8 10 0 2 4 6 8 10 Pressure (bar) H adsorption capacity (wt%) 2 H adsorption capacity (wt. %) 2 H adsorption capacity (wt%) 2 3.0 3.0 2.5 Adsorption CMK-1 Adsorption NiO-CMK-1 Desorption CMK-1 Desorption NiO-CMK-1 1.4 1.2 1.0 0.8 0.6 0.4 0.2 0.0 0.0 0.2 0.4 0.6 Presure (bar) 0.8 1.0 2.0 1.5 1.0 0.5 0.0 0 2 4 6 8 10 0 2 4 6 8 10 Pressure (bar) Fig S4: Hydrogen isotherm sorption curves of a: CMK-1, ZnO-CMK-1 and b): NiOCMK-1 at 77 K 3


