How Build Your Own Spreadsheet Models
advertisement
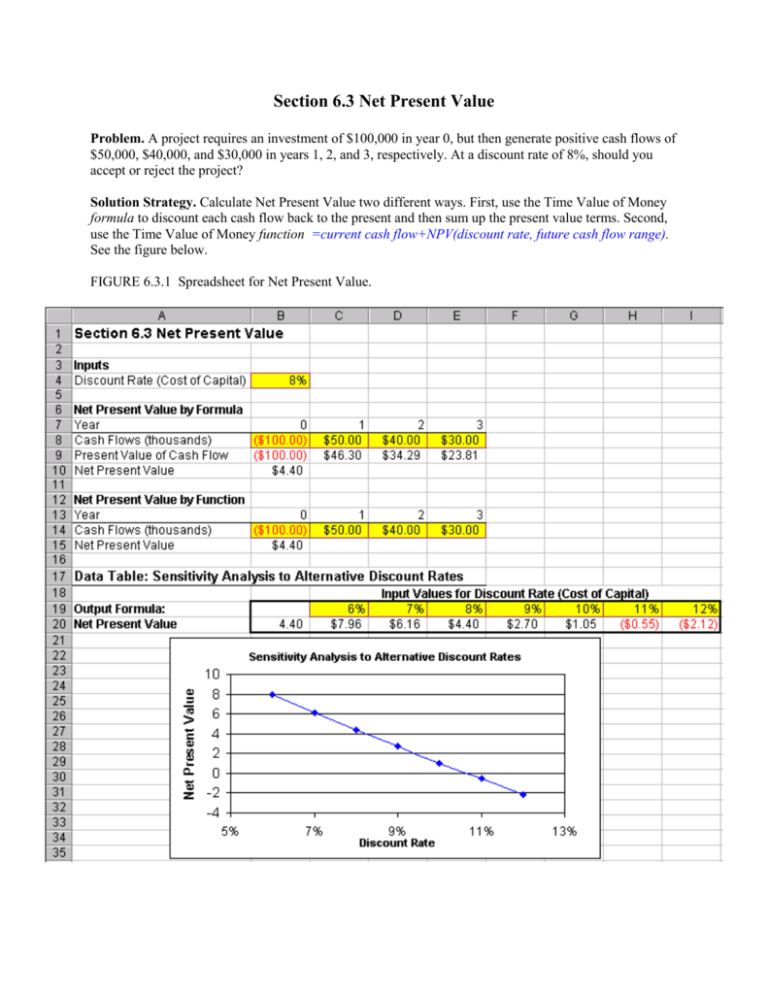
Section 6.3 Net Present Value Problem. A project requires an investment of $100,000 in year 0, but then generate positive cash flows of $50,000, $40,000, and $30,000 in years 1, 2, and 3, respectively. At a discount rate of 8%, should you accept or reject the project? Solution Strategy. Calculate Net Present Value two different ways. First, use the Time Value of Money formula to discount each cash flow back to the present and then sum up the present value terms. Second, use the Time Value of Money function =current cash flow+NPV(discount rate, future cash flow range). See the figure below. FIGURE 6.3.1 Spreadsheet for Net Present Value. How To Build Your Own Spreadsheet Model. (1) Inputs. Enter the Discount Rate in cell B4, the year-by-year Cash Flows in the range B8:E8, and the same Cash Flows in the range B4:B7. Note that the Year 0 cash flow is negative, because it represents a cash outflow. (2) Net Present Value by Formula. Calculate the present value of the cash flows by entering the Time Value of Money formula =B8/((1+$B$4)^B7) in cell B9. Copy this formula from cell B9 across the range C9:E9. The Discount Rate $B$4 uses an absolute reference because it stays constant from year to year. For convenience, the number of times to compound B7 is taken from the year number. Calculate Net Present Value by summing all of the present value of cash flow terms. Enter =SUM(B9:E9) in cell B10. (3) Net Present Value by Function. Calculate Net Present Value by using the Time Value of Money function =current cash flow + NPV(discount rate, future cash flow range). Enter =B14+NPV(B4,C14:E14) in cell B15. Note that the NPV function assumes that future case flows start in year 1, so the current (year 0) cash flow must be added separately. The Net Present Value is positive, so the project should be accepted. Notice you get the same answer by formula or by function! Using The Power Of Your Spreadsheet Model. Suppose your not sure about the exact discount rate. You can test the sensitivity of the project NPV to the discount rate. (1) Create A List of Input Values and An Output Formula. Create a list of input values for the Discount Rate (6%, 7%, 8%, etc.) in the range C19:I19. Create an output formula that references the product NPV by entering the formula =B15 in cell B20. (2) Data Table. Select the range B19:I20 for the Data Table. This range includes both the list of input values at the top of the data table and the output formula on the side of the data table. Then choose Data Table from the main menu and a Table dialog box pops up. Enter the cell address B4 (for the Discount Rate) in the Row Input Cell and click on OK. (3) Graph the Sensitivity Analysis. Highlight the data table C19:I20 and then choose Insert Chart from the main menu. Select an XY(Scatter) chart type and make other selections to complete the Chart Wizard. The sensitivity analysis shows that the NPV is positive over a wide range of discount rates (6% - 10%) and doesn’t go negative until 11% or above. This should inspire confidence that the calculation of a positive NPV for the project is a robust result.
