CSC 340 Test 1 - People Server at UNCW
advertisement
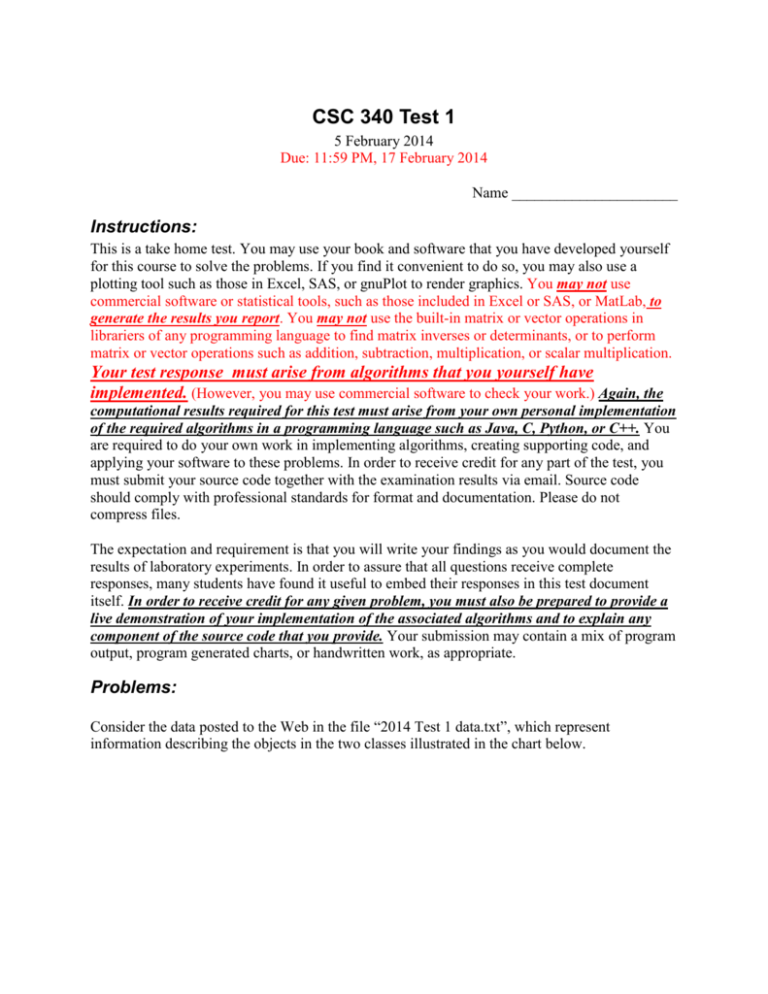
CSC 340 Test 1 5 February 2014 Due: 11:59 PM, 17 February 2014 Name ______________________ Instructions: This is a take home test. You may use your book and software that you have developed yourself for this course to solve the problems. If you find it convenient to do so, you may also use a plotting tool such as those in Excel, SAS, or gnuPlot to render graphics. You may not use commercial software or statistical tools, such as those included in Excel or SAS, or MatLab, to generate the results you report. You may not use the built-in matrix or vector operations in librariers of any programming language to find matrix inverses or determinants, or to perform matrix or vector operations such as addition, subtraction, multiplication, or scalar multiplication. Your test response must arise from algorithms that you yourself have implemented. (However, you may use commercial software to check your work.) Again, the computational results required for this test must arise from your own personal implementation of the required algorithms in a programming language such as Java, C, Python, or C++. You are required to do your own work in implementing algorithms, creating supporting code, and applying your software to these problems. In order to receive credit for any part of the test, you must submit your source code together with the examination results via email. Source code should comply with professional standards for format and documentation. Please do not compress files. The expectation and requirement is that you will write your findings as you would document the results of laboratory experiments. In order to assure that all questions receive complete responses, many students have found it useful to embed their responses in this test document itself. In order to receive credit for any given problem, you must also be prepared to provide a live demonstration of your implementation of the associated algorithms and to explain any component of the source code that you provide. Your submission may contain a mix of program output, program generated charts, or handwritten work, as appropriate. Problems: Consider the data posted to the Web in the file “2014 Test 1 data.txt”, which represent information describing the objects in the two classes illustrated in the chart below. For questions 1-8, suppose that the objects in the two classes have been measured with respect to two parameters, x and y, and the measurements are multivariate normally distributed for each dimension for each class. 1. Find the mean vectors m1 and m2 for each of the classes. (Note: m1 and m2 are each nx1 vectors where n=2.) This problem requires the computation of a sum of nx1 vectors, and computing a scalar multiple, 1/k, of the sum for each class, where k is the number of objects in each class. 2. Find the covariance matrices 1 and 2 for the classes. This problem requires multiplying each nx1 vector in a class by its 1xn transpose, accumulating the sum of the nxn products for the class, and multiplying the sum for the class by a scalar, 1/k. 3. Find and report the determinants of the covariance matrices |1| and | 2| for the classes. This problem exploits the determinant finder derived from the Gauss reduction algorithm. 4. Find and report the inverses of the covariance matrices 1-1 and 2-1for the classes. This problem uses the inverse finder algorithm derived from the Gauss-Jordan reduction algorithm. 5. Find and report the discriminant functions g1(x) and g2(x) for the classes? Report these with the right-hand side of each equation in matrix form. Refer to the classifier lecture notes for a detailed example. 6. Into which classes would your classifier place the points m1 and m2? Use your matrix tools to evaluate the discriminant functions to support your choices. 7. Use your personally implemented matrix manipulation tools to determine how many classification errors occur when you apply the discriminant functions to the example data? a. List the misclassified points separately for each class and provide the values of both discriminant functions for each point. (It might be a good idea to use a table to organize this response. b. Summarize your findings by presenting a table of the tallies of correctly and incorrectly classified items. The table could contain one row and one column for each class. In the table, the entry in row j and column k should report the number of objects in class j that the classifier indicates should be in class k.) i. How many examples are correctly identified for each class? ii. How many examples are incorrectly identified for each class? 8. Estimate and plot the boundary contour generated by the classifier. a. Notice that along the exact boundary contour g1(x) = g2(x) so that for an estimation of the boundary, | g1(x) - g2(x)| ≈ 0.0. b. Subdivide the area of interest into a grid and evaluate the magnitude of the difference of discriminant function values, |g1(x) - g2(x)| at the grid points. c. Choose and report a small value ε. d. When | g1(x) - g2(x)| < ε, report (so that you can plot) a boundary marker point. 9. Linear systems: a. If one a solution exists, use your implementation of Gauss-Jordan Elimination Algorithm to estimate the solution for the following linear system: 2 x 2 y 3z w a b 9c 2d 1 x 2 z 3w 3a c 3d 2 2 y z 2 w 3a 4b 2c 3 2 x 3 y z w 2 a b 2 d 4 . 5 x 2 y z 3w 4b 5c 4d 4 3x z 2 w a 2b 3c 4d 3 2 x 3z w 3a b 2d 2 y 3z w 3a 5b 3c 6d 4 b. What is the determinant of the coefficient matrix A? c. If they exist, what are i. The inverse of the coefficient matrix A-1, ii. The determinant of A-1, and iii. The product of the determinants of A and A-1? d. If A-1 exists, check your system solution results by performing the appropriate matrix multiplication and reporting the results. 10. If it exists, what is the condition number for the coefficient matrix for the system given in problem 9?
