Quality Control Exercises
advertisement
Quality Control Exercises
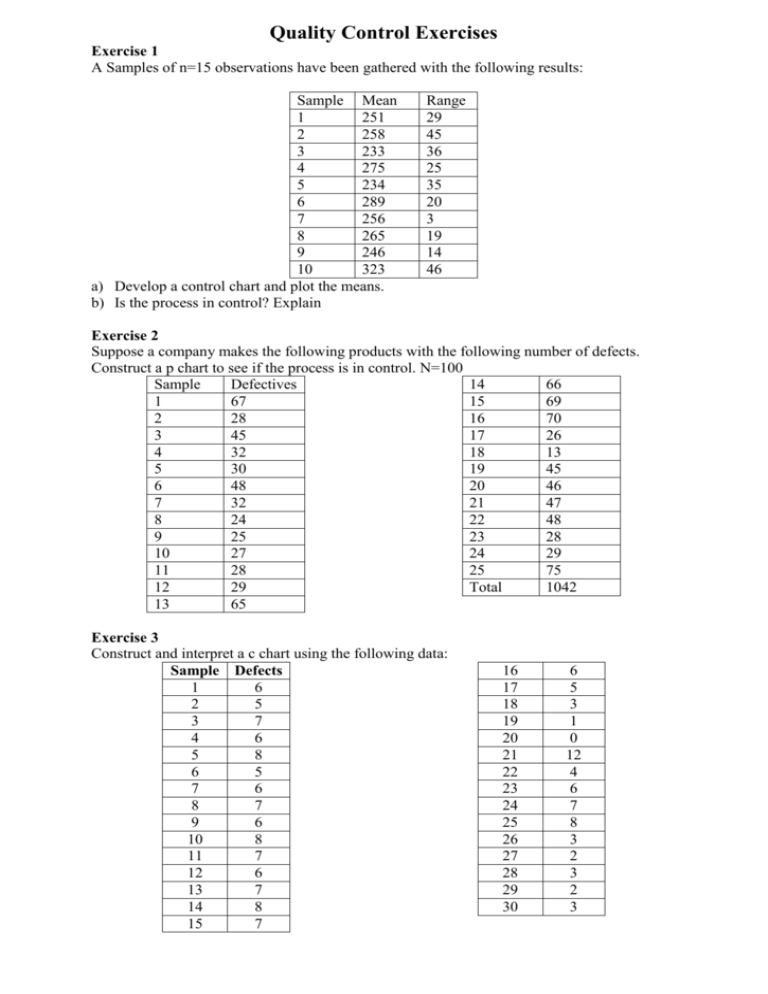
Exercise 1
A Samples of n=15 observations have been gathered with the following results:
Sample Mean
1
251
2
258
3
233
4
275
5
234
6
289
7
256
8
265
9
246
10
323
a) Develop a control chart and plot the means.
b) Is the process in control? Explain
Range
29
45
36
25
35
20
3
19
14
46
Exercise 2
Suppose a company makes the following products with the following number of defects.
Construct a p chart to see if the process is in control. N=100
Sample
Defectives
14
66
1
67
15
69
2
28
16
70
3
45
17
26
4
32
18
13
5
30
19
45
6
48
20
46
7
32
21
47
8
24
22
48
9
25
23
28
10
27
24
29
11
28
25
75
12
29
Total
1042
13
65
Exercise 3
Construct and interpret a c chart using the following data:
Sample Defects
1
6
2
5
3
7
4
6
5
8
6
5
7
6
8
7
9
6
10
8
11
7
12
6
13
7
14
8
15
7
16
17
18
19
20
21
22
23
24
25
26
27
28
29
30
6
5
3
1
0
12
4
6
7
8
3
2
3
2
3
Exercise 4
For each of the accompanying control charts , analyze the data using both median and
up/down run test with z=±1,96 limits. Are nonrandom variants present? Assume he center line
is long term median.
Exercise 5
Tolerances for a new assembly call for weights between 32 and 33 pounds. The assembly is
made using a process that has a mean of 32,6 pounds with a population standard deviation of
0,22 pounds. The process population is normally distributed.
a) Is the process capable?
b) If not, what proportion will not meet tolerances?
Solution
Exercise 1
x1 x 2 .... x m
x
263
m
R R2 ...... R3
R 1
27,2
m
UCLx x A2 R 263 0,223 27,2 269,07
LCLx x A2 R 263 0,223 27,2 256,93
x-bar chart
Mean
300
250
200
1
2
3
4
5
6
7
8
9
10
Sample
UCLR D4 R 1,652 27,2 44,96
LCLR D3 R 0,348 27,2 9,47
Range
range chart
50
40
30
20
10
0
1
2
3
4
5
6
Sample
Exercise 2.
np
1042
p
0,4168
n
25 100
p(1 p)
0,4168 0,5832
p
0,0493
n
100
UCLp p z p 0,4168 3 0,0493 0,5647
LCL p p z p 0,4168 3 0,0493 0,2689
7
8
9
10
p-chart
Mean
0,8
0,6
0,4
0,2
0
1
2
3
4
5
6
7
8
9
10 11 12 13 14 15 16 17 18 19 20 21 22 23 24 25
Sample
Exercise 3
c
164
5,47
30
UCLc c 3 c 5,47 3 5,47 12,486
LCLc c 3 c 5,47 3 5,47 1,546 0
c-chart
Mean
15
10
5
0
1
2
3
4
5
6
7
8
9 10 11 12 13 14 15 16 17 18 19 20 21 22 23 24 25 26 27 28 29 30
Sample
Exercise 4
Median A/B: AA BB A B A BB A B AA B AAA BBB A B A B A B 18
Up/Down: DDD U D U DD U D UU D UU DDD UU D U D U D 17
N=26
N
26
E (r ) med 1
1 14
2
2
2 N 1 2 26 1
E (r ) u / d
17
3
3
N 1
26 1
med
2,5
4
4
16 N 29
16 26 29
u/d
2,07
90
90
observed exp ected 18 14
z med
1,6
deviation
2,5
observed exp ected 17 17
zu / d
0
deviation
2,07
Both value fall into the interval (-1,96;1,96), thus the process is in control, only random
variant is present.
Exercise 5
USL LSL 33 32
Cp
0,5051
6
6 0,22
(USL ) 33 32,6
0,6061
3ˆ
3 0,22
( LSL) 32,6 32
Cpl
0,9091
3ˆ
3 0,22
Cpk min{ Cpu; Cpl ) 0,6061
the process is not capable, because both Cp and Cpk are under 1.
b)
x 33 32,6
z
1,818
0,22
x 32 32,6
z
2,727
0,22
0,0344+0,0032=0,03763,76% of products doesn’t meet specification
Cpu
Appendix
Sample size, n
2
3
4
5
6
7
8
9
10
11
12
13
14
15
16
17
18
19
20
21
22
23
24
25
Mean
Factor,
A2
1,88
1,023
0,729
0,577
0,483
0,419
0,373
0,337
0,308
0,285
0,266
0,249
0,235
0,223
0,212
0,203
0,194
0,187
0,18
0,173
0,167
0,162
0,157
0,153
Upper
Range,
D4
3,268
2,574
2,282
2,115
2,004
1,924
1,864
1,816
1,777
1,744
1,716
1,692
1,671
1,652
1,636
1,621
1,608
1,596
1,586
1,575
1,566
1,557
1,548
1,541
Lower
Range,
D3
0
0
0
0
0
0,076
0,136
0,184
0,223
0,256
0,284
0,308
0,329
0,348
0,364
0,379
0,392
0,404
0,414
0,425
0,434
0,443
0,452
0,459
