Correlation & Regression Analysis Problem Set
advertisement

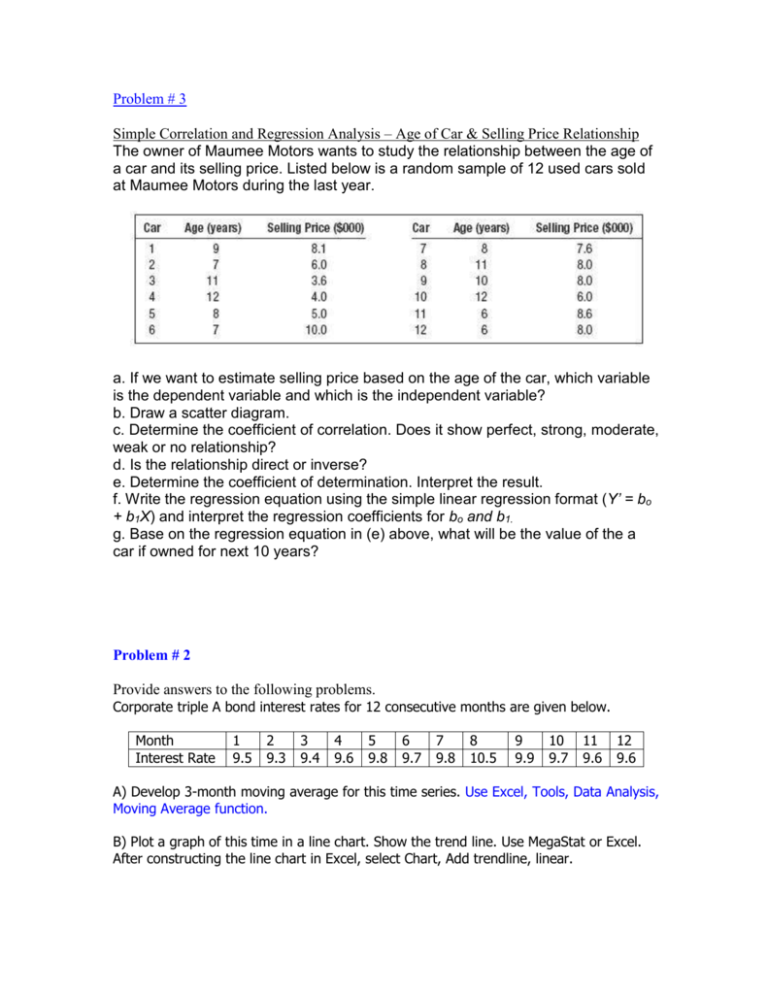
Problem # 3 Simple Correlation and Regression Analysis – Age of Car & Selling Price Relationship The owner of Maumee Motors wants to study the relationship between the age of a car and its selling price. Listed below is a random sample of 12 used cars sold at Maumee Motors during the last year. 4. See IM. b. a. If we want to estimate selling price based on the age of the car, which variable is the dependent variable and which is the independent variable? b. Draw a scatter diagram. c. Determine the coefficient of correlation. Does it show perfect, strong, moderate, weak or no relationship? d. Is the relationship direct or inverse? e. Determine the coefficient of determination. Interpret the result. f. Write the regression equation using the simple linear regression format (Y’ = bo + b1X) and interpret the regression coefficients for bo and b1. g. Base on the regression equation in (e) above, what will be the value of the a car if owned for next 10 years? Problem # 2 Provide answers to the following problems. Corporate triple A bond interest rates for 12 consecutive months are given below. Month Interest Rate 1 9.5 2 9.3 3 9.4 4 9.6 5 9.8 6 9.7 7 9.8 8 10.5 9 9.9 10 9.7 11 9.6 12 9.6 A) Develop 3-month moving average for this time series. Use Excel, Tools, Data Analysis, Moving Average function. B) Plot a graph of this time in a line chart. Show the trend line. Use MegaStat or Excel. After constructing the line chart in Excel, select Chart, Add trendline, linear.


