AP Stats Chapter 3 Assignments
advertisement
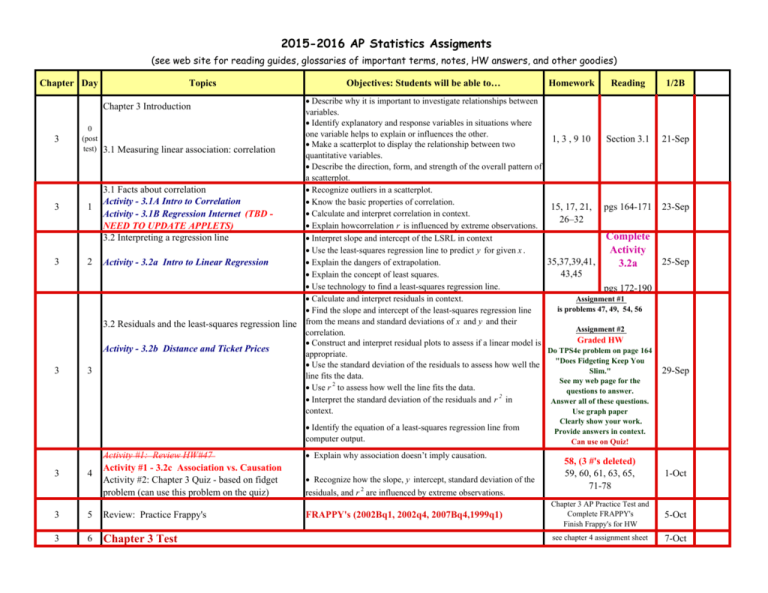
2015-2016 AP Statistics Assigments (see web site for reading guides, glossaries of important terms, notes, HW answers, and other goodies) Chapter Day Topics Chapter 3 Introduction 3 0 (post test) 3 1 3 2 3.1 Measuring linear association: correlation 3.1 Facts about correlation Activity - 3.1A Intro to Correlation Activity - 3.1B Regression Internet (TBD NEED TO UPDATE APPLETS) 3.2 Interpreting a regression line Activity - 3.2a Intro to Linear Regression 3.2 Residuals and the least-squares regression line Activity - 3.2b Distance and Ticket Prices 3 3 Objectives: Students will be able to… 3 4 3 5 Review: Practice Frappy's 3 6 Chapter 3 Test Reading Describe why it is important to investigate relationships between variables. Identify explanatory and response variables in situations where one variable helps to explain or influences the other. Section 3.1 1, 3 , 9 10 Make a scatterplot to display the relationship between two quantitative variables. Describe the direction, form, and strength of the overall pattern of a scatterplot. Recognize outliers in a scatterplot. Know the basic properties of correlation. 15, 17, 21, pgs 164-171 Calculate and interpret correlation in context. 26–32 Explain howcorrelation r is influenced by extreme observations. Complete Interpret slope and intercept of the LSRL in context Activity Use the least-squares regression line to predict y for given x . 35,37,39,41, Explain the dangers of extrapolation. 3.2a 43,45 Explain the concept of least squares. Use technology to find a least-squares regression line. pgs 172-190 Assignment #1 Calculate and interpret residuals in context. is problems 47, 49, 54, 56 Find the slope and intercept of the least-squares regression line from the means and standard deviations of x and y and their Assignment #2 correlation. Graded HW Construct and interpret residual plots to assess if a linear model is Do TPS4e problem on page 164 appropriate. "Does Fidgeting Keep You Use the standard deviation of the residuals to assess how well the Slim." line fits the data. See my web page for the 2 Use r to assess how well the line fits the data. questions to answer. Interpret the standard deviation of the residuals and r 2 in Answer all of these questions. context. Use graph paper Identify the equation of a least-squares regression line from computer output. Activity #1: Review HW#47 Activity #1 - 3.2c Association vs. Causation Activity #2: Chapter 3 Quiz - based on fidget problem (can use this problem on the quiz) Homework Explain why association doesn’t imply causation. Recognize how the slope, y intercept, standard deviation of the residuals, and r 2 are influenced by extreme observations. FRAPPY's (2002Bq1, 2002q4, 2007Bq4,1999q1) 1/2B comme nts 21-Sep 22-Sep 23-Sep 24-Sep 25-Sep 26-Sep 29-Sep 30-Sep Clearly show your work. Provide answers in context. Can use on Quiz! 58, (3 #'s deleted) 59, 60, 61, 63, 65, 71-78 1-Oct 2-Oct Chapter 3 AP Practice Test and Complete FRAPPY's Finish Frappy's for HW 5-Oct 6-Oct see chapter 4 assignment sheet 7-Oct 8-Oct

