Research Methods: Statistics Test
advertisement
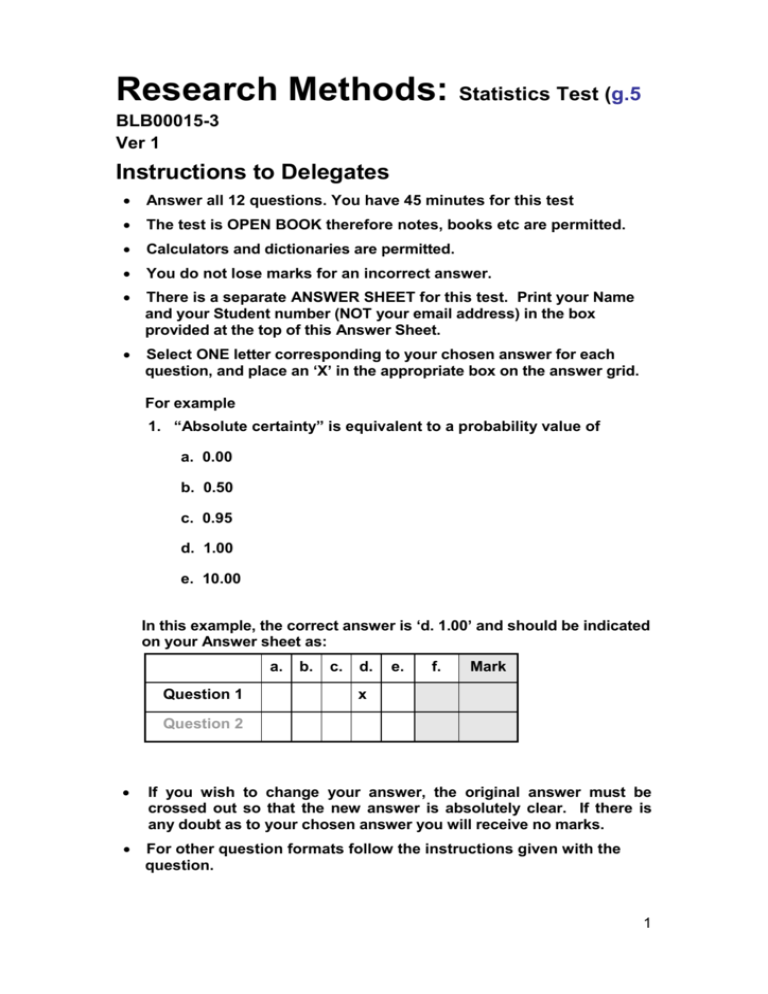
Research Methods: Statistics Test (g.5 BLB00015-3 Ver 1 Instructions to Delegates Answer all 12 questions. You have 45 minutes for this test The test is OPEN BOOK therefore notes, books etc are permitted. Calculators and dictionaries are permitted. You do not lose marks for an incorrect answer. There is a separate ANSWER SHEET for this test. Print your Name and your Student number (NOT your email address) in the box provided at the top of this Answer Sheet. Select ONE letter corresponding to your chosen answer for each question, and place an ‘X’ in the appropriate box on the answer grid. For example 1. “Absolute certainty” is equivalent to a probability value of a. 0.00 b. 0.50 c. 0.95 d. 1.00 e. 10.00 In this example, the correct answer is ‘d. 1.00’ and should be indicated on your Answer sheet as: a. Question 1 b. c. d. e. f. Mark x Question 2 If you wish to change your answer, the original answer must be crossed out so that the new answer is absolutely clear. If there is any doubt as to your chosen answer you will receive no marks. For other question formats follow the instructions given with the question. 1 Research Methods: Answer Sheet Student Name Student Number a b c d e f Mark Question 1 Question 2 Question 3 Question 4 Question 5 Question 6 Question 7 Question 8 Question 9 Question 10 Question 11 Question 12 SCORE TOTAL SCORE 0 0% 1 8% 2 3 4 5 6 7 8 9 10 11 12 17% 25% 33% 42% 50% 58% 67% 75% 83% 92% 100% 2 1. Use the appropriate table (provided) to answer the following question. You are a market researcher for and have been asked to commission a survey of public opinion in a small town with a population of 100,000. Assume that the required Confidence Level is 95% and that for each question the degree of variability in the population is at a maximum (i.e., P=0.5), which means that for each question one response is as likely as another. What will be the precision (margin of error) in your results if you decide to survey a maximum of 1100 people? 2. a. +1% b. +3% c. +5% d. +7% e. +10% The profit, in £’000, from a random sample of eight weeks sales in a builders merchant is found to be: Week 1 2 3 4 5 6 7 8 Sales 63 57 60 57 50 61 63 62 The estimated mean of all weekly profits is: (£’000) a. 60.3 b. 59.6 c. 59.1 d. 61.0 e. 58.9 3 3. The profit, in £’000, from a random sample of eight weeks sales in a builders merchant is found to be: Week 1 2 3 4 5 6 7 8 Sales 63 57 60 57 50 61 63 62 What is the median value of weekly profits 59 b. 63 c 60.5 d 53.5 e 59.1 The following graph describes call out charges made charged by a heating equipment repair company over a 4 month period Frequency Density Number of repairs per £20 interval 4. a. 10 5 0 0 20 40 60 80 100 120 140 160 180 200 Repair Cost £ A reasonable estimate for the mode is: a) 0-39 b) 40-59 c) 80-99 d) 80-119 e) 160-200 4 5. Use the expected value formula to answer this question. A project board is assessing the merits of two countries as the site for an international building project. The normal project length is 8 months in Country A and 7months in Country B. Based on these figures Country B is the favoured site. However the board know that political unrest is possible in either Country. They also know that political unrest will increase project length by 7 months in Country A and by 9 months in Country B. An expert in international politics estimates that there is a 0.4 (40%) probability of political unrest in either Country. What are the expected values for project length in the two locations A and B (in months)? 6. a. b. 11.2 and 10.9 8.7 and 9.1 c. d. e. 12.2.and 11.8 7.2 and 8.4 10.4 and 10.6 Firm A claims that its brand of tyres has an average lifetime of 24,000 miles. A random sample of 25 tyres are tested and found to have an average lifetime of 22,700 miles with a standard deviation (s) of 1000 miles. An analyst from Firm B uses this sample evidence to assess Firm A’s claim by testing the null (or maintained) hypothesis that the population mean is 24,000 miles against the alternative hypothesis that the population mean is less than 24,000. The appropriate test statistic is a. 6.50 b. 1.83 c. 2.36 d. 3.75 e. 5.64 5 7. A sample of eight customers spent the following amounts (in £) at the local Garden centre: Week 1 2 3 4 5 6 7 8 Sales 63 57 60 57 50 61 63 62 What is the standard deviation of customer spending 8. 9. a. 5.2 b. 4.4 c. 6.8 d. 5.6 e. 57.0 You are going to carry out a one tailed hypothesis test using a large sample of 100 items. What is the critical value (z) at a 5% level of significance a. 3.09 b. 3.29 c. 1.64 d. 2.58 The ‘Yellow Custard’ company packs its custard in packs which nominally weigh 3 kg. These weights of these packs are known to follow a normal distribution with a mean weight of 3.1 kg with a standard deviation of 0.1 kg. You select a bag at random: What is the probability that the bag contains less than 2.9 kg? a) 0.035 b) 0.052 c) 0.151 d) 0.023 e) 0.031 6 10. From a representative sample of 160 shoppers at a supermarket, 120 say that they prefer fresh fish to pre-packaged fish. The 95 percent confidence limits for the estimated percentage of all customers preferring fresh fish are a) 75% 6.7% b) 75% 3.3% c) 75% 7.4% d) 75% 6.4% e) 75% + 7.2% 11. In a squash tournament the last 6 competitors have the following probabilities of winning based on prior success. A and B have a 0.2 chance of winning, C, D and E have a 0.15 chance of winning. What is the probability that competitor F will win a. 0.1 b. 0.2 c. 0.15 d. 0.35 e. 0.30 f. 0.25 7 12. The following table shows the effects of a quantitative skills course on different groups of students. Improved No improvement Level 1 38 22 Level 2 17 23 Level 3 9 16 Postgraduate 21 9 The Chi-square test statistic he generates for this data (rounded to 2 decimal places) is a. 9.53 b. 7.63 c. 8.38 d. 10.58 e. 11.49 8


