Chapter 6 iClicker Questions
advertisement
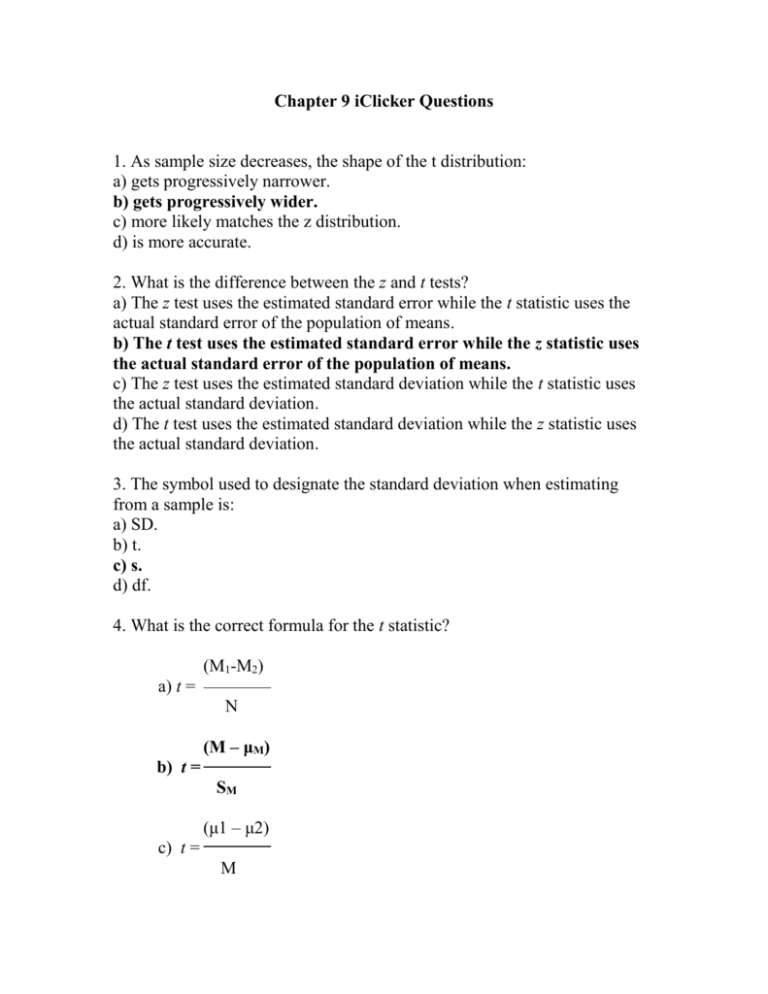
Chapter 9 iClicker Questions 1. As sample size decreases, the shape of the t distribution: a) gets progressively narrower. b) gets progressively wider. c) more likely matches the z distribution. d) is more accurate. 2. What is the difference between the z and t tests? a) The z test uses the estimated standard error while the t statistic uses the actual standard error of the population of means. b) The t test uses the estimated standard error while the z statistic uses the actual standard error of the population of means. c) The z test uses the estimated standard deviation while the t statistic uses the actual standard deviation. d) The t test uses the estimated standard deviation while the z statistic uses the actual standard deviation. 3. The symbol used to designate the standard deviation when estimating from a sample is: a) SD. b) t. c) s. d) df. 4. What is the correct formula for the t statistic? (M1-M2) a) t = N (M – μM) b) t = SM (μ1 – μ2) c) t = M (M – μ) d) t = S 5. A(n) ___________________ is a type of t test in which we compare data from one sample to a population for which we know the mean but not the standard deviation. a) single-sample t test b) nonparametric t test c) independent samples t test d) dependent samples t test 6. The formula for degrees of freedom for a single sample t test is: a) df = N – 1 b) df = N+P c) df = N – 2 d) df = dfx + dfy 7. According to your text book, all of the following are steps involved in calculating a single sample t-test EXCEPT: a) identify the populations, distribution, and assumptions. b) calculate the z scores c) state the null and research hypotheses d) determine the critical values, or cutoffs 8. Which of the following is the formula for the upper bound of the confidence interval for a single sample t test? a) M upper = t(sM) b) M upper = - t(sM) + Msample c) M upper = t(sM) + Msample d) M upper = t(sM) - Msample 9. Which of these is the correct formula for calculating effect size for a single sample t test? a) Cohen d = (M - µ) / s b) M upper = t(sM) + M sample c) T = (M - µm) / sm d) df – N – 1 10. All of the following are steps in constructing a dot plot EXCEPT: a) Cluster the data in your data set together to reduce the number of dots. b) Determine the lowest score and highest score of the sample. c) Draw an x-axis and label it, including the values from the lowest to the highest scores. d) Place a dot above the appropriate value for every score. 11. It is hypothesized that there is a significant difference in depression levels between men and woman in a college dormitory. This hypothesis best illustrates: a) research hypothesis. b) null hypothesis. c) standardized hypothesis. d) subjective probability hypothesis. 12. It is hypothesized that there will be a significant difference in aggression scores after caffeine consumption as compared to before caffeine consumption. This hypothesis best illustrates what type of t test? a) a single-sample t test b) a nonparametric t test c) an independent samples t test d) a paired samples t test 13. A paired samples t test is also known as a(n): a) single sample t test. b) independent samples t test. c) dependent samples t test. d) confidence interval.
