Term
advertisement
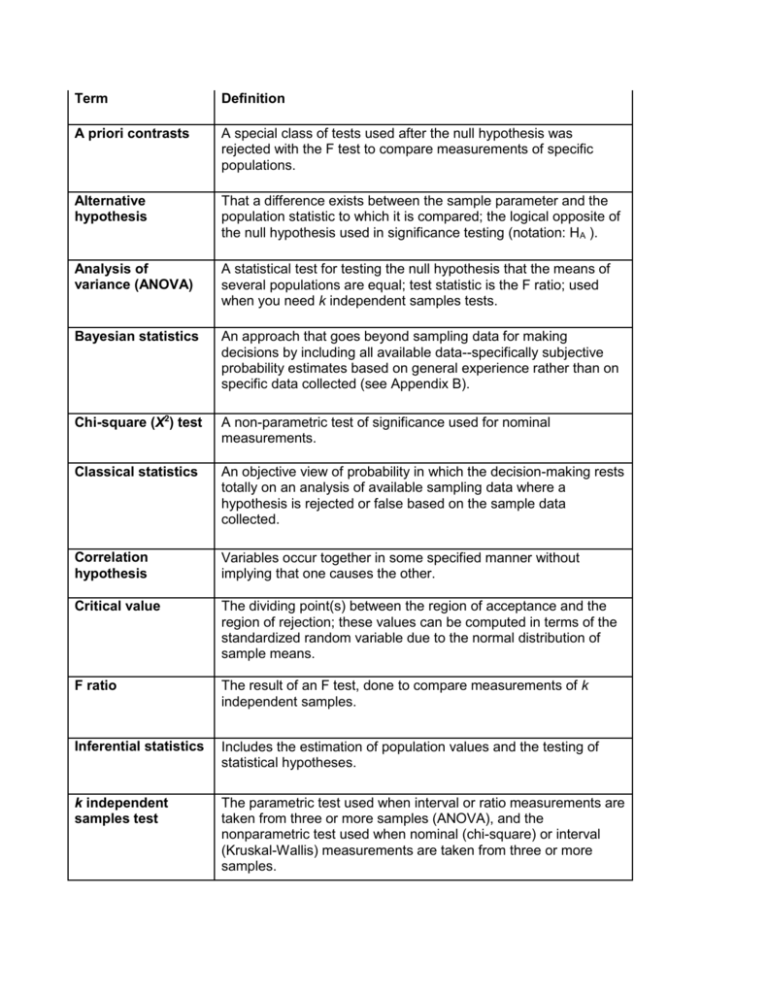
Term Definition A priori contrasts A special class of tests used after the null hypothesis was rejected with the F test to compare measurements of specific populations. Alternative hypothesis That a difference exists between the sample parameter and the population statistic to which it is compared; the logical opposite of the null hypothesis used in significance testing (notation: HA ). Analysis of variance (ANOVA) A statistical test for testing the null hypothesis that the means of several populations are equal; test statistic is the F ratio; used when you need k independent samples tests. Bayesian statistics An approach that goes beyond sampling data for making decisions by including all available data--specifically subjective probability estimates based on general experience rather than on specific data collected (see Appendix B). Chi-square (X2) test A non-parametric test of significance used for nominal measurements. Classical statistics An objective view of probability in which the decision-making rests totally on an analysis of available sampling data where a hypothesis is rejected or false based on the sample data collected. Correlation hypothesis Variables occur together in some specified manner without implying that one causes the other. Critical value The dividing point(s) between the region of acceptance and the region of rejection; these values can be computed in terms of the standardized random variable due to the normal distribution of sample means. F ratio The result of an F test, done to compare measurements of k independent samples. Inferential statistics Includes the estimation of population values and the testing of statistical hypotheses. k independent samples test The parametric test used when interval or ratio measurements are taken from three or more samples (ANOVA), and the nonparametric test used when nominal (chi-square) or interval (Kruskal-Wallis) measurements are taken from three or more samples. k related samples test The parametric (ANOVA) and nonparametric tests (Cochran Q for nominal measurements and Friedman for ordinal measurements) used when comparing measurements from more than two groups from the same sample or more than two measures from the same subject or respondent. Level of significance The probability of rejecting a true null hypothesis. See also significance. Multiple comparison (post hoc) procedures Tests of significance on comparison measures done after the results are compared; tests use group means and incorporate the MSerror term of the F ratio. Non-parametric tests One of the two general classes of significance tests, these tests use data derived from nominal and ordinal measurements and must meet three other assumptions: independence of observations, normally distributed populations, and equal variances. Normal probability plot A diagnostics tool that compares the observed values with those expected from a normal distribution. Null hypothesis That no difference exists between the sample parameter and the population statistic to which it is compared; notation: HO. One-sample tests Tests that involve measures taken from a single sample. One-tailed test A directional test of a null hypothesis that considers only one possibility: that the sample parameter is not the same as the population statistic. Parametric tests One of the two general classes of significance tests, these tests use data derived from interval and ratio measurements. Power of the test 1 minus the probability of committing a Type II error, or one minus the probability that we will correctly reject the false null hypothesis. Practical significance When a statistically significant difference has real importance to the decision maker. Regions of acceptance Area between the two regions of rejection based on a chosen level of significance (two-tailed test) or the area above/below the region of acceptance on a one tailed test. Regions of rejection Area beyond the region of acceptance set by the level of significance. Statistical significance The quality of the difference between a sample value and its population value; the difference is statistical significance if it is unlikely to have occurred by chance (represent random sampling fluctuations). T distribution A normal distribution with more tail area than in a Z normal distribution. Treatment (factor) The experimental factor to which subjects are exposed. Trials (repeated measures) Repeated measures taken from the same subject. t-test A parametric test to determine the statistical significance between a sample distribution mean and a population parameter, when the population standard deviation is unknown and the sample standard deviation is used as a proxy. Two independent samples tests Parametric and nonparametric tests used when the measurements are taken from two samples that are unrelated (Z test, t-test, chi-square, etc.). Two related samples tests Parametric and nonparametric tests used when the measurements are taken from closely matched samples or the phenomena are measured twice from the same sample; t-test, McNemar test, etc). Two-tailed test A non-directional test of a null hypothesis that considers two possibilities: that the sample parameter is either greater than the population statistic or less than the population statistic. Type I error A type of hypothesis testing error when a true null hypothesis (there is no difference) is rejected; the alpha (α) value called the level of significance is the probability of rejecting the true null hypothesis. Type II error A type of hypothesis testing error when a false null hypothesis (there is no difference) is rejected; the beta (β) value is the probability of incorrectly rejecting the false null hypothesis; the power of the test =1 - β, and is the probability that we will correctly reject the false null hypothesis. Z distribution The normal distribution of measurements assumed for comparison. Z test The parametric test to determine the statistical significance between a sample distribution mean and a population parameter employs the Z distribution.


