MATH 3070: Worksheet No.5 NAME: 1. In 1994 survey of 507 adult
advertisement
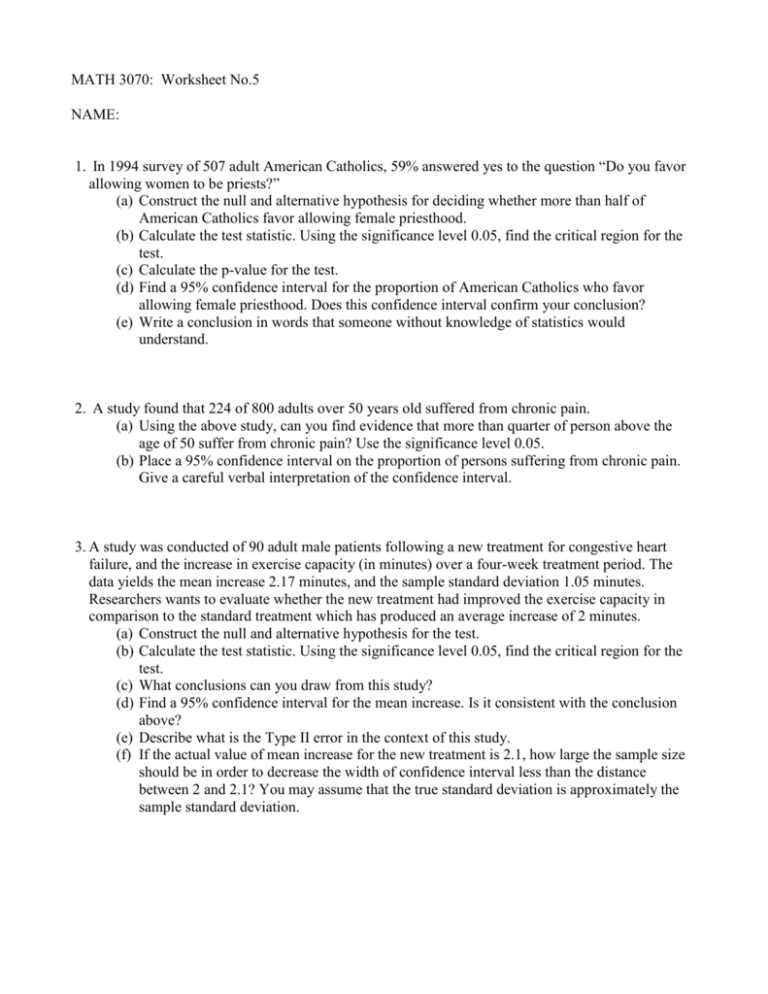
MATH 3070: Worksheet No.5 NAME: 1. In 1994 survey of 507 adult American Catholics, 59% answered yes to the question “Do you favor allowing women to be priests?” (a) Construct the null and alternative hypothesis for deciding whether more than half of American Catholics favor allowing female priesthood. (b) Calculate the test statistic. Using the significance level 0.05, find the critical region for the test. (c) Calculate the p-value for the test. (d) Find a 95% confidence interval for the proportion of American Catholics who favor allowing female priesthood. Does this confidence interval confirm your conclusion? (e) Write a conclusion in words that someone without knowledge of statistics would understand. 2. A study found that 224 of 800 adults over 50 years old suffered from chronic pain. (a) Using the above study, can you find evidence that more than quarter of person above the age of 50 suffer from chronic pain? Use the significance level 0.05. (b) Place a 95% confidence interval on the proportion of persons suffering from chronic pain. Give a careful verbal interpretation of the confidence interval. 3. A study was conducted of 90 adult male patients following a new treatment for congestive heart failure, and the increase in exercise capacity (in minutes) over a four-week treatment period. The data yields the mean increase 2.17 minutes, and the sample standard deviation 1.05 minutes. Researchers wants to evaluate whether the new treatment had improved the exercise capacity in comparison to the standard treatment which has produced an average increase of 2 minutes. (a) Construct the null and alternative hypothesis for the test. (b) Calculate the test statistic. Using the significance level 0.05, find the critical region for the test. (c) What conclusions can you draw from this study? (d) Find a 95% confidence interval for the mean increase. Is it consistent with the conclusion above? (e) Describe what is the Type II error in the context of this study. (f) If the actual value of mean increase for the new treatment is 2.1, how large the sample size should be in order to decrease the width of confidence interval less than the distance between 2 and 2.1? You may assume that the true standard deviation is approximately the sample standard deviation. 4. A federal regulatory agency is investigating an advertised claim that a certain device can increase the gasoline mileage of car. Ten of these devices are purchased and installed in cars. Gasoline mileage (mpg) for each of the cars is recorded both before and after installation. The data are listed in the following table. Car 1 2 3 4 5 6 7 8 9 10 Before 19.1 29.9 17.6 20.2 23.5 26.8 21.7 25.7 19.5 28.2 After 25.8 23.7 28.7 25.4 32.8 19.2 29.6 22.3 25.7 20.1 Change 6.7 -6.2 11.1 5.2 9.3 -7.6 7.9 -3.4 6.2 -8.1 (a) Present summary statistics. (b) Construct the null and the alternative hypothesis to determine whether there is a significant gain in mileage after the devices were installed. (c) Construct a QQ normal plot, and assess the normality of the sample distribution. (d) Calculate the test statistic and find the critical point for the test. (e) Given the significance level 0.05, interpret your findings. (f) Calculate a 95% confidence interval for the mean change. (g) Do you suggest the change in sample size? Assuming the current estimates of mean and standard deviation are reasonably accurate, determine a desired margin of error and calculate the sample size required. (h) Write your suggestion for some changes in the study. 5. Answer the following questions regarding the study in “Dissolution Rate”, and report your findings. (Data file dissolution.csv) (a) Present a short description of the study and the data, including summary statistics. (b) Construct the null and the alternative hypothesis for the claim that the batch of pills has a mean dissolution rate less than 20 mg. (c) Construct a QQ normal plot, and assess the normality of the sample distribution. (d) Calculate the test statistic and the critical value for the test. (e) Given the significance level 0.01, interpret your findings. (f) Calculate a 99% confidence interval, and incorporate it into a conclusion. (g) Write your conclusion of statistical report. 6. Answer the following questions regarding the study in “SO2 Emission”, and report your findings. (Data files so2.csv) (a) Present a short description of the study and the data, including summary statistics. (b) Construct the null and the alternative hypothesis for the claim that the average SO2 emission using the new scrubber is less than 0.145. (c) Calculate the test statistic and the critical value for the test. (d) State your conclusion for the test.
