Minitab Demonstration for One-Factor Analysis of Variance
advertisement
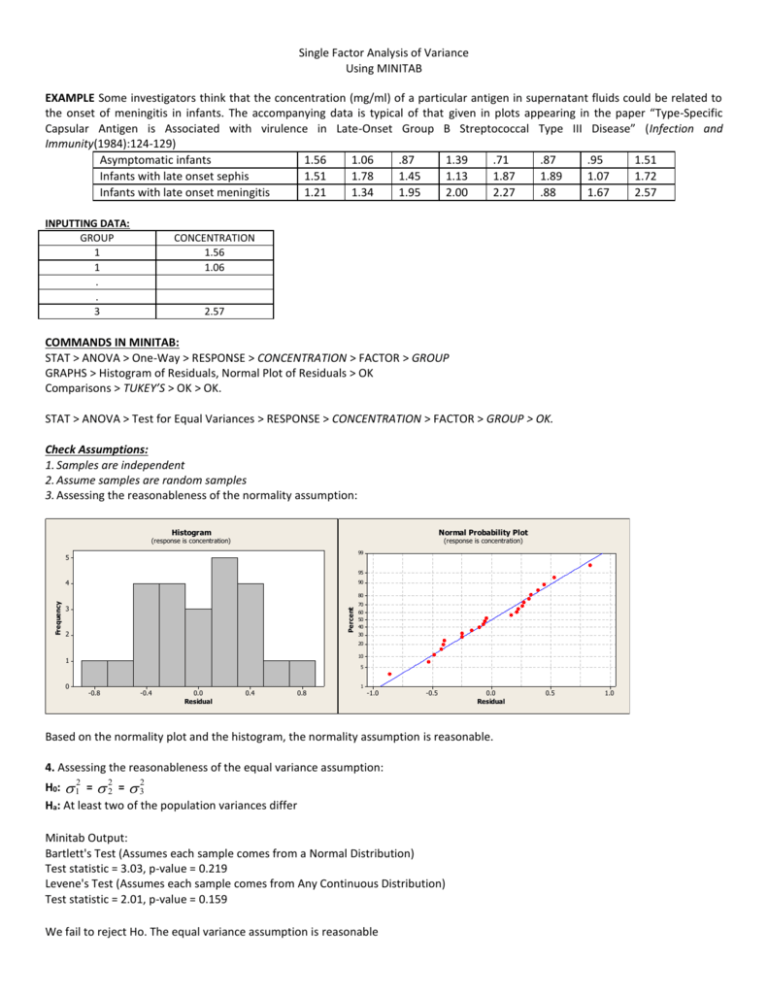
Single Factor Analysis of Variance Using MINITAB EXAMPLE Some investigators think that the concentration (mg/ml) of a particular antigen in supernatant fluids could be related to the onset of meningitis in infants. The accompanying data is typical of that given in plots appearing in the paper “Type-Specific Capsular Antigen is Associated with virulence in Late-Onset Group B Streptococcal Type III Disease” (Infection and Immunity(1984):124-129) Asymptomatic infants 1.56 1.06 .87 1.39 .71 .87 .95 1.51 Infants with late onset sephis 1.51 1.78 1.45 1.13 1.87 1.89 1.07 1.72 Infants with late onset meningitis 1.21 1.34 1.95 2.00 2.27 .88 1.67 2.57 INPUTTING DATA: GROUP 1 1 . . 3 CONCENTRATION 1.56 1.06 2.57 COMMANDS IN MINITAB: STAT > ANOVA > One-Way > RESPONSE > CONCENTRATION > FACTOR > GROUP GRAPHS > Histogram of Residuals, Normal Plot of Residuals > OK Comparisons > TUKEY’S > OK > OK. STAT > ANOVA > Test for Equal Variances > RESPONSE > CONCENTRATION > FACTOR > GROUP > OK. Check Assumptions: 1. Samples are independent 2. Assume samples are random samples 3. Assessing the reasonableness of the normality assumption: Histogram Normal Probability Plot (response is concentration) (response is concentration) 99 5 95 4 90 Percent Frequency 80 3 2 70 60 50 40 30 20 10 1 0 5 -0.8 -0.4 0.0 Residual 0.4 0.8 1 -1.0 -0.5 0.0 Residual Based on the normality plot and the histogram, the normality assumption is reasonable. 4. Assessing the reasonableness of the equal variance assumption: H0: 12 = 22 = 32 Ha: At least two of the population variances differ Minitab Output: Bartlett's Test (Assumes each sample comes from a Normal Distribution) Test statistic = 3.03, p-value = 0.219 Levene's Test (Assumes each sample comes from Any Continuous Distribution) Test statistic = 2.01, p-value = 0.159 We fail to reject Ho. The equal variance assumption is reasonable 0.5 1.0 Since assumptions are reasonable, we can perform the Analysis of Variance One-way Analysis of Variance Ho: 1= 2 = 3 Ha: At least two of the population means are different. =.05. Minitab Ouput: One-way ANOVA: Concentration versus Group Source Group Error Total DF 2 21 23 SS 1.630 3.729 5.359 MS 0.815 0.178 F 4.59 P 0.022 p-value < , thus reject H0. The data provide sufficient evidence to conclude that at least two of the population means are different. Now Perform Tukey’s Multiple Comparisons to locate where the differences are. Minitab Output: Tukey 95% Simultaneous Confidence Intervals All Pairwise Comparisons among Levels of Group Individual confidence level = 98.00% Group = 1 subtracted from: Group 2 3 Lower -0.0929 0.0909 Center 0.4375 0.6213 Upper 0.9679 1.1516 ----+---------+---------+---------+----(----------*---------) (---------*----------) ----+---------+---------+---------+-----0.50 0.00 0.50 1.00 Group = 2 subtracted from: Group 3 Lower -0.3466 Center 0.1838 Upper 0.7141 ----+---------+---------+---------+----(----------*---------) ----+---------+---------+---------+-----0.50 0.00 0.50 1.00 If interval does not include 0, the corresponding population means are declared different. Thus, only 1 and 3 are declared different. Interval for 2-1: ( -.0929 , .9679) Interval for 3-1: (.0909 , 1.1516)* Interval for 3-2: ( -.3466 , .7141)
