Production Possibilities Curve Practice Worksheet
advertisement
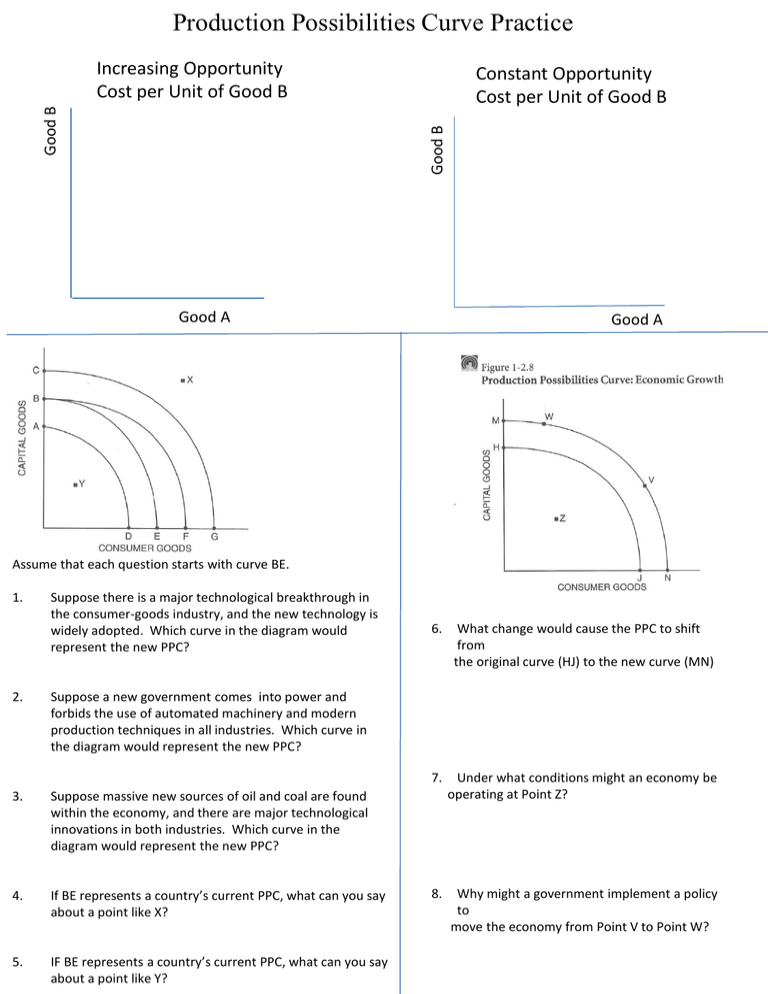
Production Possibilities Curve Practice Constant Opportunity Cost per Unit of Good B Good B Good B Increasing Opportunity Cost per Unit of Good B Good A Good A Assume that each question starts with curve BE. 1. Suppose there is a major technological breakthrough in the consumer-goods industry, and the new technology is widely adopted. Which curve in the diagram would represent the new PPC? 2. Suppose a new government comes into power and forbids the use of automated machinery and modern production techniques in all industries. Which curve in the diagram would represent the new PPC? 3. Suppose massive new sources of oil and coal are found within the economy, and there are major technological innovations in both industries. Which curve in the diagram would represent the new PPC? 4. If BE represents a country’s current PPC, what can you say about a point like X? 5. IF BE represents a country’s current PPC, what can you say about a point like Y? 6. What change would cause the PPC to shift from the original curve (HJ) to the new curve (MN) 7. Under what conditions might an economy be operating at Point Z? 8. Why might a government implement a policy to move the economy from Point V to Point W?
