1 + - NYU Stern
advertisement
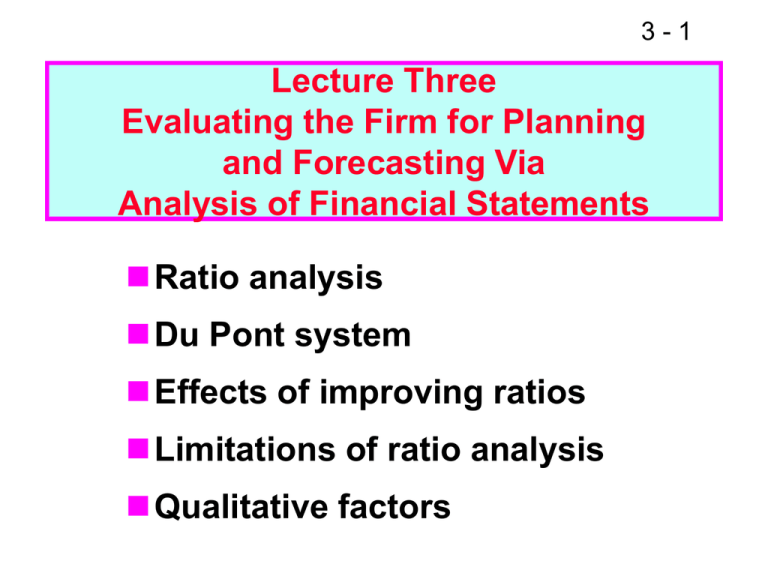
3-1 Lecture Three Evaluating the Firm for Planning and Forecasting Via Analysis of Financial Statements Ratio analysis Du Pont system Effects of improving ratios Limitations of ratio analysis Qualitative factors 3-2 Balance Sheet: Assets Cash AR Inventories Total CA Gross FA Less: Deprec. Net FA Total assets 1998E 85,632 878,000 1,716,480 2,680,112 77% 1,197,160 380,120 817,040 3,497,152 1997 7,282 632,160 1,287,360 1,926,802 67% 1,202,950 263,160 939,790 2,866,592 3-3 Liabilities and Equity 1998E 1997 Accounts payable 436,800 524,160 Notes payable 600,000 720,000 Accruals 408,000 489,600 Total CL 1,444,800 41%1,733,760 60% Long-term debt 500,000 14%1,000,000 35% Common stock 1,680,936 460,000 Retained earnings (128,584) (327,168) Total equity 1,552,352 44% 132,832 5% Total L & E 3,497,152 2,866,592 3-4 Income Statement Sales COGS Other expenses Depreciation Tot. op. costs EBIT Interest exp. EBT Taxes (40%) Net income 1998E 7,035,600 5,728,000 680,000 116,960 6,524,960 510,640 88,000 422,640 169,056 253,584 1997 5,834,400 5,728,000 680,000 116,960 6,524,960 (690,560) 176,000 (866,560) (346,624) (519,936) 3-5 Other Data 1998E 1997 250,000 100,000 EPS $1.014 ($5.199) DPS $0.220 $0.110 Shares out. Stock price $12.17 $2.25 Lease pmts $40,000 $40,000 3-6 Why are ratios useful? Standardize numbers; facilitate comparisons Used to highlight weaknesses and strengths 3-7 What are the five major categories of ratios, and what questions do they answer? Liquidity: Can we make required payments? Asset management: Right amount of assets vs. sales? 3-8 Debt management: Right mix of debt and equity? Profitability: Do sales prices exceed unit costs, and are sales high enough as reflected in PM, ROE, and ROA? Market value: Do investors like what they see as reflected in P/E and M/B ratios? 3-9 Calculate D’Leon’s forecasted current and quick ratios for 1998. CA CR98 = CL $2,680 = $1,445 = 1.85x. CA - Inv. QR98 = CL $2,680 - $1,716 = = 0.67x. $1,445 3 - 10 Comments on CR and QR 1998 1997 1996 Ind. CR 1.85x 1.1x 2.3x 2.7x QR 0.67x 0.4x 0.8x 1.0x Expected to improve but still below the industry average. Liquidity position is weak. 3 - 11 What is the inventory turnover ratio vs. the industry average? Sales Inv. turnover = Inventories $7,036 = = 4.10x. $1,716 1998 1997 1996 Ind. Inv. T. 4.1x 4.5x 4.8x 6.1x 3 - 12 Comments on Inventory Turnover Inventory turnover is below industry average. D’Leon might have old inventory, or its control might be poor. No improvement is currently forecasted. 3 - 13 DSO is the average number of days after making a sale before receiving cash. Receivables DSO = Average sales per day Receivables $878 = Sales/360 = $7,036/360 = 44.9. 3 - 14 Appraisal of DSO DSO 1998 44.9 1997 39.0 1996 36.8 Ind. 32.0 D’Leon collects too slowly, and is getting worse. Poor credit policy. 3 - 15 F.A. and T.A. turnover vs. industry average Fixed assets Sales = turnover Net fixed assets $7,036 = = 8.61x. $817 Total assets = turnover Sales Total assets $7,036 = = 2.01x. $3,497 3 - 16 FA TO TA TO 1998 1997 1996 8.6x 6.2x 10.0x 2.0x 2.0x 2.3x Ind. 7.0x 2.6x FA turnover project to exceed industry average. Good. TA turnover not up to industry average. Caused by excessive current assets (A/R and inv.) 3 - 17 Calculate the debt, TIE, and fixed charge coverage ratios. Total debt Debt ratio = Total assets $1,445 + $500 = = 55.6%. $3,497 EBIT TIE = Int. expense $510.6 = = 5.8x. $88 3 - 18 Fixed charge = FCC coverage EBIT + Lease payments = Interest Lease Sinking fund pmt. + + expense pmt. (1 - T) $510.6 +$40 = = 4.3x. $88 + $40 + $0 All three ratios reflect use of debt, but focus on different aspects. 3 - 19 How do the debt management ratios compare with industry averages? D/A TIE FCC 1998 55.6% 5.8x 4.3x 1997 1996 Ind. 95.4% 54.8% 50.0% -3.9x 3.3x 6.2x -3.0x 2.4x 5.1x Too much debt, but projected to improve. 3 - 20 Another Debt Management Ratio used commonly is: D/E A L+NW CA D FA E TA TL+NW=E To convert into something more familiar as D/TA we simply D/TA = D/E D/E + 1 D or TA = D E Example: if D/E = 0.91 D TA = 0.91 1 + 0.91 = 0.91 1.91 = 47% (1 + D E ) 3 - 21 20 Profit margin vs. industry average? NI $253.6 P.M. = Sales = $7,036 = 3.6%. P.M. 1998 1997 1996 3.6% -8.9% 2.6% Ind. 3.5% Very bad in 1997, but projected to exceed industry average in 1998. Looking good. 3 - 22 21 BEP vs. Industry Average? EBIT BEP = Total assets $510.6 = $3,497 = 14.6%. 3 - 23 22 BEP 1998 1997 1996 Ind. 14.6% -24.1% 14.2% 19.1% BEP removes effect of taxes and financial leverage. Useful for comparison. Projected to be below average. Room for improvement. 3 - 24 23 Return on Assets Net income ROA = Total assets $253.6 = $3,497 = 7.3%. 3 - 25 24 Net income ROE = Common equity = $253.6 = 16.3%. $1,552 ROA ROE 1998 1997 1996 Ind. 7.3% -18.1% 6.0% 9.1% 16.3% -391.0% 13.3% 18.2% Both below average but improving. 3 - 26 25 Effects of Debt on ROA and ROE ROA is lowered by debt--interest lowers NI, which also lowers ROA = NI/Assets. But use of debt lowers equity, hence could raise ROE = NI/Equity. 3 - 27 26 Calculate and appraise the P/E and M/B ratios. Price = $12.17. NI $253.6 EPS = Shares out. = 250 = $1.01. Price per share $12.17 P/E = = = 12x. EPS $1.01 3 - 28 27 Com. equity BVPS = Shares out. $1,552 = = $6.21. 250 Mkt. price per share M/B = Book value per share $12.17 = $6.21 = 1.96x. 3 - 29 28 P/E M/B 1998 12.0x 1.96x 1997 1996 -0.4x 9.7x 1.7x 1.3x Ind. 14.2x 2.4x P/E: How much investors will pay for $1 of earnings. High is good. M/B: How much paid for $1 of BV. Higher is good. P/E and M/B are high if ROE is high, risk is low. 3 - 30 29 ( Profit margin )( TA turnover )( Equity multiplier ) = ROE NI Sales TA Sales x TA x CE = ROE. 1996 2.6% x 2.3 1997 -8.9% x 2.0 1998 3.6% x 2.0 Ind. 3.5% x 2.6 x x x x 2.2 21.9 2.3 2.0 = 13.2% = -391.0% = 16.3% = 18.2% 3 - 31 Converting Equity Multiplier into Debt/TA and vice versa TD = 1TA ( 1 EM ) = 1 -( TE TA ) 1 EM = 1- ( TD TA ) If firm has Preferred Stock, must adjust formula by using CE in place of TE and subtracting PS from TA. 3 - 32 30 The Du Pont system focuses on: Expense control (P.M.) Asset utilization (TATO) Debt utilization (Eq. Mult.) It shows how these factors combine to determine the ROE. Ratio Analysis Spread Sheet Example De Leon Ratio Categories CURRENT QUICK INVENTORY TURNOVER DAYS SALES OUTSTANDING (DSO) Asset FIXED ASSETS TURNOVER Management TOTAL ASSETS TURNOVER DEBT RATIO Leverage TIE FIXED CHARGE COVERAGE PROFIT MARGIN BASIC EARNING POWER Profitability ROA ROE PRICE/EARNINGS Market MARKET/BOOK BOOK VALUE PER SHARE “Z” SCORE BANKRUPCY Liquidity 1998E 1.9 0.7 4.1 44.9 8.6 2.0 55.6 5.8 4.3 3.6 14.6 7.2 16.3 12.0 2.0 $6.21 3.803 1997 1.1x 0.4x 4.5x 39.0 6.2x 2.0x 95.4% -3.9x -3.0x -8.9% -24.1% -18.1% -391.4% -0.4x 1.7x $1.33 1.209 3 - 33 1996 2.3x 0.8x 4.8x 36.8 10.0x 2.3x 54.8% 3.3x 2.4x 2.6% 14.2% 6.0% 13.3% 9.7x 1.3x $6.64 4.156 Industry Average 2.7x 1.0x 6.1x 32.0 7.0x 2.6x 50.0% 6.2x 5.1x 3.5% 19.1% 9.1% 18.2% 14.2x 2.4x N.A. 3 - 34 Altman’s “Z” Score Multiple Discriminant Analysis (MDA) statistical technique similar to regression analysis. Used to classify companies in two groups: High probability of bankruptcy Low probability of bankruptcy High probability of bankruptcy exists when: * 1. There is high leverage (Mkt. Value of Stk./Book value of Debt) X-4 * 2. Low liquidity (NWC/Assets) X-1 * 3. Low return on assets (EBIT/Assets) X-3 * 4. Poor asset utilization (Sales/Total Assets) X-5 * 5. Poor reinvestment opportunities (RE/TA) X-2 * all in extended Du Pont equation. MDA helps determine the actual probability of bankruptcy for a given level of any of above ratios plus it captures the effect of the interrelationship between the ratios. It is a technique used very much in banks & S&Ls in granting credit to customers; investment banks rating bonds (specially junk bonds). 84% success in predicting 2 years ahead. 70% success in predicting 5 years ahead. 3 - 35 31 Simplified D’Leon Data A/R 878 Debt Other CA 1,802 Equity Net FA 817 Total assets $3,497 L&E Sales day 1,945 1,552 $3,497 $7,035,600 = = $19,543. 360 Q. How would reducing DSO to 32 days affect the company? 3 - 36 32 Effect of reducing DSO from 44.9 days to 32 days: Old A/R = 19,543 x 44.9 = 878,000 New A/R = 19,543 x 32.0 = 625,376 Cash freed up: 252,624 Initially shows up as additional cash. 3 - 37 33 New Balance Sheet Added cash A/R Other CA Net FA Total assets $ 253 Debt $1,945 625 Equity 1,552 1,802 817 $3,497 Total L&E $3,497 What could be done with the new cash? Effect on stock price and risk? 3 - 38 34 Potential use of freed up cash Repurchase stock. Higher ROE, higher EPS. Expand business. Higher profits. Reduce debt. Better debt ratio; lower interest, hence higher NI. All these actions would improve stock price. 3 - 39 35 Inventories are also too high. Could analyze the effect of an inventory reduction on freeing up cash and increasing the quick ratio and asset management ratios--similar to what was done with DSO in slides #31 - #33. 3 - 40 36 Q. Would you lend money to the company? A. Maybe. Things could get better. In business, one has to take some chances! 3 - 41 37 Company should not have relied exclusively on debt to finance its expansion. 3 - 42 D’LEON Analysis/Diagnosis/Prescription I. Examination or Analysis: A. Statement of Cash Flow B. Ratios II. Diagnosis or conclusions about the situation: •An expansion began in 1996, which was financed with Long Term and Short Term debt. (Evident on the ratios and the balance sheets). The company apparently assumed that sales and profits would increase automatically with the expansion. Sales actually lagged and all ratios deteriorated in 1997. •As sales in ‘97 increased consistently in subsequent months they provided support for a more optimistic sales forecast for 1998. All ratios improve dramatically in ‘98 except collection period or DSO. III. Prescription or recommendations: 3 - 43 •In hindsight, before the company took on its expansion plans, it should have done an extensive ratio analysis to determine the effects of its proposed expansion on the firm’s operations. Had the ratio analysis been conducted, the company would have “gotten its house in order” before undergoing the expansion. For instance it would have used equity financing for part of the expansion. Without it they should not have expanded. The equity financing is indispensable for plant and capacity expansion because this source of funding does not require interest, principal, or dividend payments, giving the firm time to slowly increase its sales to utilize the added capacity and time to reach its eventual profitability target. That is a more conservative sales growth plan should have been assumed and the expansion at least partly financed by equity. Even losses could have been planned as is often the case after an expansion of plant capacity. The ratios in 1998 are pretty acceptable, except for two, and show the expected increase in sales. If the sales materialize they will be fine. If not, they may have to raise some equity financing and pay back some of the debt. The two ratios that are still deficient even in 1998 are DSO and Total Asset Turnover. Which show that the company credit policy is too lose and needs to be tightened. If they can improve their collections they can decrease the DSO and hence the invested funds into accounts receivable. Illustrated in blueprints 3-31 through 3-34. •On the other hand, if the lenient credit is part of a predetermined strategy to increase sales to plant capacity by capturing a larger share of the market while the products become popular, then the higher level of receivables will have to be sustained but more equity financing might be required. •All in all, the Co. seems to have very short run expansion or growing pains principally because all the expansion was financed with debt. 3 - 44 38 What are some potential problems and limitations of financial ratio analysis? Comparison with industry averages is difficult if the firm operates many different divisions. 3 - 45 39 “Average” performance not necessarily good. Seasonal factors can distort ratios. “Window dressing” techniques can make statements and ratios look better. 3 - 46 40 Different operating and accounting practices distort comparisons. Sometimes hard to tell if a ratio is “good” or “bad.” Difficult to tell whether company is, on balance, in strong or weak position. 3 - 47 41 What are some qualitative factors analysts should consider when evaluating a company’s likely future financial performance? Are the company’s revenues tied to 1 key customer? To what extent are the company’s revenues tied to 1 key product? To what extent does the company rely on a single supplier? (Cont…) 3 - 48 42 What percentage of the company’s business is generated overseas? Competition Future prospects Legal and regulatory environment Management/Labor Relations and Productivity

