Slide Show
advertisement
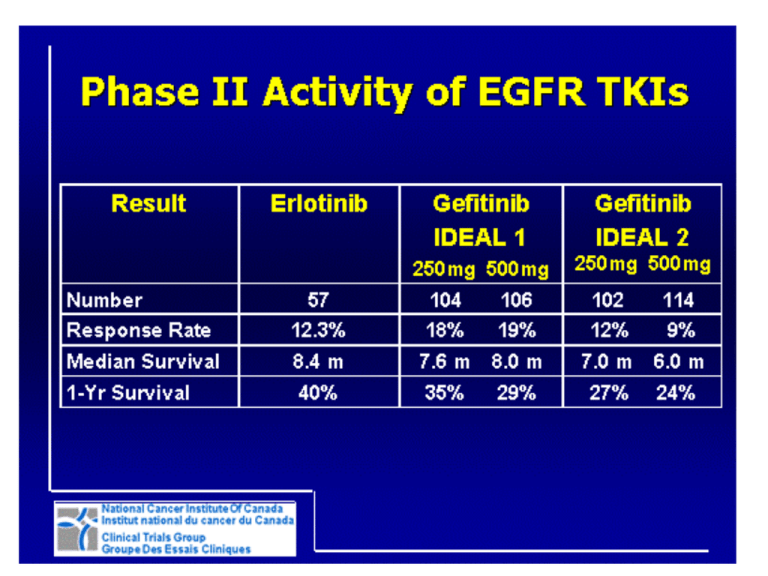
BR.21 Study Design Stratified by: Centre PS, 0/1 vs 2/3 Response to prior Rx (CR/PR:SD:PD) Prior regimens, (1 vs 2) Prior platinum, (Yes vs no) Erlotinib* 150mg/day R *2:1 Randomization Placebo “150 mg” daily Shepherd et al. N Engl J Med. 2005;353:123-132. BR.21 Progression-Free Survival 100 ___ Erlotinib, _____ Placebo Percen tage 80 2.2 mos 60 1.8 mos *HR 0.61, p <0.0001 40 *Adjusted for stratification factors (except centre) AND EGFR status 20 0 0.0 488 243 5.0 153 34 Months 10.0 15.0 20.0 52 6 8 1 1 0 Time (months) # At Risk(OSI-774) # At Risk(Placebo) OSI-774 Placebo SUMMARY STATISTICS: Log-Rank tes t for equality of groups : p=0.0000 Wilc ox on tes t for equality of groups : p=0.0000 Shepherd et al. N Engl J Med. 2005;353:123-132. BR.21: Overall Survival Survival distribution function 1.00 0.75 Erlotinib Placebo (n=488) (n=243) Median survival (months) 6.7 4.7 1-year survival (%) 31 21 HR=0.70 (95% CI, 0.58-0.85); P < 0.001* *HR and P-value adjusted for stratification factors at randomization plus HER1/EGFR status. 0.50 31% 42.5% improvement in median survival 0.25 Erlotinib 21% Placebo 0 0 5 10 15 20 25 30 Survival time (months) Shepherd et al. N Engl J Med. 2005;353:123-132. IPASS Study Design Chemonaïve advanced NSCLC Gefitinib 250mg/day Adenocarcinoma Non-smoker or light smoker N = 1217 • Primary endpoint: PFS R Paclitaxel (200 mg/m2, IV, d1) plus carboplatin (AUC=5 or 6 mg/min) repeated every 3 weeks up to 6 cycles • Secondary endpoints: ORR, OS, QoL and safety Mok TS, et al. N Engl J Med. 2009 Sep 3;361(10):947-57. 1.0 Gefitinib EGFR M+ Gefitinib EGFR MC / P EGFR M+ C / P EGFR M- 0.8 0.6 0.4 0.2 0.0 1.0 Probability of survival Probability of progression-free survival IPASS: PFS PFS and (2008)OS by Known EGFR Mutation OS (2010) Status 0.8 Mutation + 0.6 0.4 0.2 Mutation - 0.0 0 4 8 12 16 20 24 Time from randomisation (months) 0 4 8 12 16 20 24 28 32 36 40 44 48 Time from randomisation (months) 52 Patients at risk excludes censored patients and those who have experienced an event Yang CH et al. ESMO 2010 INTEREST Study Design Endpoints Patients • Age ≥18 years • Life expectancy ≥8 weeks • Progressive or recurrent disease following CT Primary IRESSA 250 mg/day 1:1 randomization • Considered candidates for further CT with docetaxel •1 or 2 CT regimens (≥1 platinum) • PS Docetaxel 74 mg.m2 every 3 weeks 0-2 • Overall survival (co-primary analysesa of noninferiority in all patients and superiority in patients with high EGFR gene copy number) Secondary • Progression-free survival • Objective response rate • Quality of life • Disease-related symptoms • Safety and tolerability Exploratory • Biomarkers aModified Hochberg procedure applied to control for multiple testing CT: chemotherapy; PS: performance status Kim ES, et al. Lancet. 2008 Nov 22;372(9652):1809-18. INTEREST: Gefitinib vs. Docetaxel in NSCLC After Chemotherapy Gefitinib demonstrated non-inferior survival compared with docetaxel OS in overall study population OS in patients with high EGFR gene copy number 1.0 Probability of survival 0.8 HR (96% CI) = 1.020 (0.905, 1.150) HR (95% CI) = 1.09 (0.78, 1.51) P = 0.6199 0.6 Gefitinib Docetaxel 0.4 0.2 0.0 0 20 Months 36 40 0 20 Months 40 Kim ES, et al. Lancet. 2008 Nov 22;372(9652):1809-18. SATURN Study Design Run-in Period: • Patients with advanced NSCLC • Treatment with four cycles of platinumdoublet chemo • Erlotinib 150mg/day Eligibility: • No progressive disease • N = 889 R Placebo N = 1949 • Primary endpoint: PFS in all patients; PFS in patients with EGFR IHCpositive tumours • Secondary endpoints: OS in ITT and EGFR-positive tumours, PFS in EGFR-negative tumours, time to progression, tumour response, QoL Cappuzzo F, et al. Lancet Oncol. 2010 Jun;11(6):521-9. SATURN: Erlotinib vs. Placebo in NSCLC After Chemotherapy OS PFS 1.0 1.0 Erlotinib (n=437) Placebo (n=447) HR=0.71 (0.62–0.82) Log-rank p<0.0001 Probability 0.8 Erlotinib (n=438) 0.6 0.6 0.4 0.4 0.2 0.2 0 0 0 8 16 24 32 40 48 56 64 72 80 88 96 Time (weeks) Placebo (n=451) HR=0.81 (0.70–0.95) Log-rank p=0.0088 0.8 0 8 16 24 32 40 48 56 64 72 80 88 96 Time (weeks) Cappuzzo F, et al. Lancet Oncol. 2010 Jun;11(6):521-9. SATURN: EGFR Activating Mutations 1.0 Probability 0.8 PFS1 HR=0.10 (0.04–0.25) Log-rank p<0.0001 0.6 0.4 0.4 0 Erlotinib (n=22) Placebo (n=27) 0 8 16 24 32 40 48 56 64 72 80 88 96 Time (weeks) HR=0.83 (0.34–2.02) Log-rank p=0.6810 0.8 0.6 0.2 OS2 1.0 0.2 Erlotinib (n=22) Placebo (n=27) 0 0 3 6 9 12 15 18 21 24 27 30 33 36 Time (months) 1. Cappuzzo F, et al. Lancet Oncol. 2010 Jun;11(6):521-9. 2. Brugger, et al. J Thorac Oncol 2009;4 (Suppl. 1):S348–9 (Abs. Dacomitinib versus Erlotinib Phase ll PFS: Overall Population Progression-free survival probability (%) Overall population 100 90 80 70 60 50 40 30 20 10 0 PF299804 (n=94) Median: 12.4 weeks (95% CI: 8.3–16.1) Erlotinib (n=94) Median: 8.3 weeks (95% CI: 8.0–11.4) Unstratified analysis: Hazard ratio = 0.681 (95% CI: 0.490–0.945) Log-rank P-value = 0.019 0 5 10 15 20 25 30 35 40 45 Time (weeks) CI = confidence interval Post-baseline tumor assessments were initiated at week 8 and conducted every 4 weeks thereafter. Boyer et al ASCO 2010. Abstract LBA7523. 50 55 60 AFATINIB: PRECLINICAL ACTIVITY Drug IC50 (nM) WT L858R Exon 19 Del L858R/T790M Afatinib1 60 0.7 0.5 50 Erlotinib2 110 40 3.8 >4,000 Gefitinib3, 4 157 50 10-63 >4,000 PF-8045 29-63 7 2-4 119 1. Oncogene 2008;27:4702-4711. 2.Cancer Res 2006;66:8163-71. 3. Science 2004;304:1497. 4. JNCI 2005;97:1185-94. 5. Cancer Res 2007; 67:11924-32. PFS by independent review Statistically significant across almost all subgroups
