Presentación de PowerPoint
advertisement
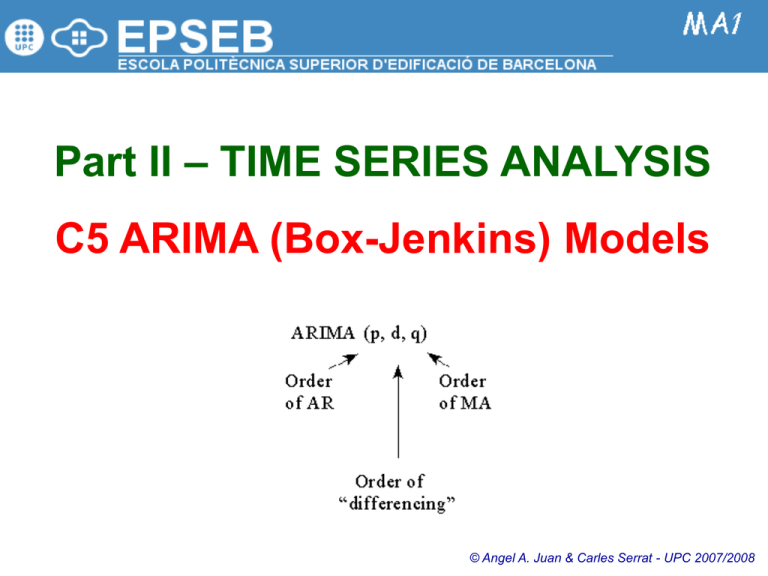
Part II – TIME SERIES ANALYSIS C5 ARIMA (Box-Jenkins) Models © Angel A. Juan & Carles Serrat - UPC 2007/2008 2.5.1: Introduction to ARIMA models Recall that stationary processes The Autoregressive Integrated Moving Average (ARIMA) vary about a fixed level, and nonstationary processes have no models, or Box-Jenkins methodology, are a class of linear natural constant mean level. models that is capable of representing stationary as well as nonstationary time series. The ACF and PACF associated to the TS ARIMA models rely heavily on autocorrelation patterns in data both ACF and PACF are used to select an initial model. The Box-Jenkins methodology uses an iterative approach: are matched with the theoretical autocorrelation pattern associated with a particular ARIMA model. 1. An initial model is selected, from a general class of ARIMA models, based on an examination of the TS and an examination of its autocorrelations for several time lags 2. The chosen model is then checked against the historical data to see whether it accurately describes the series: the model fits well if the residuals are generally small, randomly distributed, and contain no useful information. 3. If the specified model is not satisfactory, the process is repeated using a new model designed to improve on the original one. 4. Once a satisfactory model is found, it can be used for forecasting. 2.5.2: Autoregressive Models AR(p) A pth-order autoregressive model, or AR(p), takes the form: Yt 0 1Yt 1 2Yt 2 ... pYt p t An AR(p) model is a regression model with lagged values of the dependent variable in the independent variable positions, hence the name autoregressive model. Yt response variable at time t Yt k observation (predictor variable) at time t k i regression coefficients to be estimated t error term at time t Autoregressive models are appropriate for stationary time series, and the coefficient Ф0 is related to the constant level of the series. Theoretical behavior of the ACF and PACF for AR(1) and AR(2) models: AR(1) AR(2) ACF 0 ACF 0 PACF = 0 for lag > 1 PACF = 0 for lag > 2 2.5.3: Moving Average Models MA(q) A qth-order moving average model, or MA(q), takes the form: Yt t 1 t 1 2 t 2 ... q t q An MA(q) model is a regression model with the dependent variable, Yt, depending on previous values of the errors rather than on the variable itself. Yt response variable at time t constant mean of the process i regression coefficients to be estimated t k error in time period t - k The term Moving Average is historical and should not be confused with the moving average smoothing procedures. MA models are appropriate for stationary time series. The weights ωi do not necessarily sum to 1 and may be positive or negative. Theoretical behavior of the ACF and PACF for MA(1) and MA(2) models: MA(1) ACF = 0 for lag > 1; PACF 0 MA(2) ACF = 0 for lag > 2; PACF 0 2.5.4: ARMA(p,q) Models A model with autoregressive terms can be combined with a model having moving average terms to get an ARMA(p,q) model: Note that: • ARMA(p,0) = AR(p) • ARMA(0,q) = MA(q) Yt 0 1Yt 1 2Yt 2 ... pYt p t 1 t 1 2 t 2 ... q t q ARMA(p,q) models can describe a wide variety of behaviors for stationary time series. Theoretical behavior of the ACF and PACF for autoregressivemoving average processes: ACF PACF AR(p) Die out Cut off after the order p of the process MA(q) Cut off after the order q of the process Die out Die out Die out ARMA(p,q) In practice, the values of p and q each rarely exceed 2. In this context… • “Die out” means “tend to zero gradually” • “Cut off” means “disappear” or “is zero” 2.5.5: Building an ARIMA model (1/2) The first step in model identification is to determine whether the series is stationary. It is useful to look at a plot of the series along with the sample ACF. If the series is not stationary, it can often be converted to a stationary series by differencing: the original series is replaced by a series of differences and an ARMA model is then specified for the differenced series (in effect, the analyst is modeling changes rather than levels) A nonstationary TS is indicated if the series appears to grow or decline over time and the sample ACF fail to die out rapidly. In some cases, it may be necessary to difference the differences before stationary data are obtained. Models for nonstationary series are called Autoregressive Integrated Moving Average models, or ARIMA(p,d,q), where d indicates the amount of differencing. Note that: Once a stationary series has been obtained, the analyst must identify the form of the model to be used by comparing the sample ACF and PACF to the theoretical ACF and PACF for the various ARIMA models. By counting the number of significant sample autocorrelations and partial autocorrelations, the orders of the AR and MA parts can be determined. Principle of parsimony: “all things being equal, simple models are preferred to complex models” Once a tentative model has been selected, the parameters for that model are estimated using least squares estimates. ARIMA(p,0,q) = ARMA(p,q) Advice: start with a model containing few rather than many parameters. The need for additional parameters will be evident from an examination of the residual ACF and PACF. 2.5.5: Building an ARIMA model (2/2) Before using the model for forecasting, it must be checked for adequacy. Basically, a model is adequate if the residuals cannot be used to improve the forecasts, i.e., The residuals should be random and normally distributed The individual residual autocorrelations should be small. Significant residual autocorrelations at low lags or seasonal lags suggest the model is inadequate After an adequate model has been found, forecasts can be made. Prediction intervals based on the forecasts can also be constructed. As more data become available, it is a good idea to monitor the forecast errors, since the model must need to be reevaluated if: The magnitudes of the most recent errors tend to be consistently larger than previous errors, or The recent forecast errors tend to be consistently positive or negative Seasonal ARIMA (SARIMA) models contain: Regular AR and MA terms that account for the correlation at low lags Seasonal AR and MA terms that account for the correlation at the seasonal lags Many of the same residual plots that are useful in regression analysis can be developed for the residuals from an ARIMA model (histogram, normal probability plot, time sequence plot, etc.) In general, the longer the forecast lead time, the larger the prediction interval (due to greater uncertainty) In addition, for nonstationary seasonal series, an additional seasonal difference is often required 2.5.6: ARIMA with Minitab – Ex. 1 (1/4) File: PORTFOLIO_INVESTMENT.MTW Stat > Time Series > … A consulting corporation wants to try the Box-Jenkins technique for forecasting the Transportation Index of the Dow Jones. Time Series Plot of Index 290 The series show an upward trend. 280 270 250 240 230 Autocorrelation Function for Index 220 (with 5% significance limits for the autocorrelations) 210 1 6 12 18 24 30 36 Index 42 48 54 1,0 60 0,8 0,6 The first several autocorrelations are persistently large and trailed off to zero rather slowly a trend exists and this time series is nonstationary (it does not vary about a fixed level) Autocorrelation Index 260 0,4 0,2 0,0 -0,2 -0,4 -0,6 -0,8 -1,0 Idea: to difference the data to see if we could eliminate the trend and create a stationary series. 1 2 3 4 5 6 7 8 9 Lag 10 11 12 13 14 15 16 2.5.6: ARIMA with Minitab – Ex. 1 (2/4) Time Series Plot of Diff1 First order differences. 5 4 A plot of the differenced data appears to vary about a fixed level. 3 Diff1 2 1 0 -1 -2 -3 -4 1 Comparing the autocorrelations with their error limits, the only significant autocorrelation is at lag 1. Similarly, only the lag 1 partial autocorrelation is significant. The PACF appears to cut off after lag 1, indicating AR(1) behavior. The ACF appears to cut off after lag 1, indicating MA(1) behavior we will try: ARIMA(1,1,0) and ARIMA(0,1,1) 0,8 0,8 0,6 0,6 Partial Autocorrelation Autocorrelation 1,0 0,4 0,2 0,0 -0,2 -0,4 -0,6 0,0 -0,4 -0,6 -1,0 7 8 9 Lag 10 11 12 48 -0,2 -1,0 6 42 0,2 -0,8 5 30 36 Index 0,4 -0,8 4 24 (with 5% significance limits for the partial autocorrelations) 1,0 3 18 Partial Autocorrelation Function for Diff1 Autocorrelation Function for Diff1 2 12 13 14 15 16 54 60 A constant term in each model will be included to allow for the fact that the series of differences appears to vary about a level greater than zero. (with 5% significance limits for the autocorrelations) 1 6 1 2 3 4 5 6 7 8 9 Lag 10 11 12 13 14 15 16 2.5.6: ARIMA with Minitab – Ex. 1 (3/4) ARIMA(1,1,0) The LBQ statistics are not significant as indicated by the large pvalues for either model. ARIMA(0,1,1) 2.5.6: ARIMA with Minitab – Ex. 1 (4/4) Autocorrelation Function for RESI1 (with 5% significance limits for the autocorrelations) 1,0 0,8 0,4 0,2 0,0 -0,2 -0,4 -0,6 -0,8 -1,0 1 2 3 4 5 6 7 8 9 Lag 10 11 12 13 14 15 16 Autocorrelation Function for RESI2 (with 5% significance limits for the autocorrelations) 1,0 0,8 Finally, there is no significant residual autocorrelation for the ARIMA(1,1,0) model. The results for the ARIMA(0,1,1) are similar. 0,6 Autocorrelation Autocorrelation 0,6 0,4 0,2 0,0 -0,2 -0,4 -0,6 Therefore, either model is adequate and provide nearly the same one-step-ahead forecasts. -0,8 -1,0 1 2 3 4 5 6 7 8 9 Lag 10 11 12 13 14 15 16 2.5.7: ARIMA with Minitab – Ex. 2 (1/3) File: READINGS.MTW Stat > Time Series > … A consulting corporation wants to try the Box-Jenkins technique for forecasting a process. Time Series Plot of Readings 110 The time series of readings appears to vary about a fixed level of around 80, and the autocorrelations die out rapidly toward zero the time series seems to be stationary. 100 90 Readings 80 70 The first sample ACF coefficient is significantly different form zero. The autocorrelation at lag 2 is close to significant and opposite in sign from the lag 1 autocorrelation. The remaining autocorrelations are small. This suggests either an AR(1) model or an MA(2) model. 60 50 40 30 20 1 7 14 21 28 35 42 Index 49 56 63 70 The first PACF coefficient is significantly different from zero, but none of the other partial autocorrelations approaches significance, This suggests an AR(1) or ARIMA(1,0,0) Partial Autocorrelation Function for Readings Autocorrelation Function for Readings (with 5% significance limits for the partial autocorrelations) 1,0 1,0 0,8 0,8 0,6 0,6 Partial Autocorrelation Autocorrelation (with 5% significance limits for the autocorrelations) 0,4 0,2 0,0 -0,2 -0,4 -0,6 0,4 0,2 0,0 -0,2 -0,4 -0,6 -0,8 -0,8 -1,0 -1,0 2 4 6 8 10 Lag 12 14 16 18 2 4 6 8 10 Lag 12 14 16 18 2.5.7: ARIMA with Minitab – Ex. 2 (2/3) AR(1) = ARIMA(1,0,0) A constant term is included in both models to allow for the fact that the readings vary about a level other than zero. Both models appear to fit the data well. The estimated coefficients are significantly different from zero and the mean square (MS) errors are similar. Let’s take a look at the residuals ACF… MA(2) = ARIMA(0,0,2) 2.5.7: ARIMA with Minitab – Ex. 2 (3/3) Autocorrelation Function for RESI1 (with 5% significance limits for the autocorrelations) 1,0 0,8 Autocorrelation 0,6 0,4 0,2 0,0 -0,2 -0,4 -0,6 -0,8 -1,0 2 4 6 8 10 Lag 12 14 16 18 Autocorrelation Function for RESI2 (with 5% significance limits for the autocorrelations) 1,0 Therefore, either model is adequate and provide nearly the same threestep-ahead forecasts. Since the AR(1) model has two parameters (including the constant term) and the MA(2) model has three parameters, applying the principle of parsimony we would use the simpler AR(1) model to forecast future readings. 0,8 0,6 Autocorrelation Finally, there is no significant residual autocorrelation for the ARIMA(1,0,0) model. The results for the ARIMA(0,0,2) are similar. 0,4 0,2 0,0 -0,2 -0,4 -0,6 -0,8 -1,0 2 4 6 8 10 Lag 12 14 16 18
