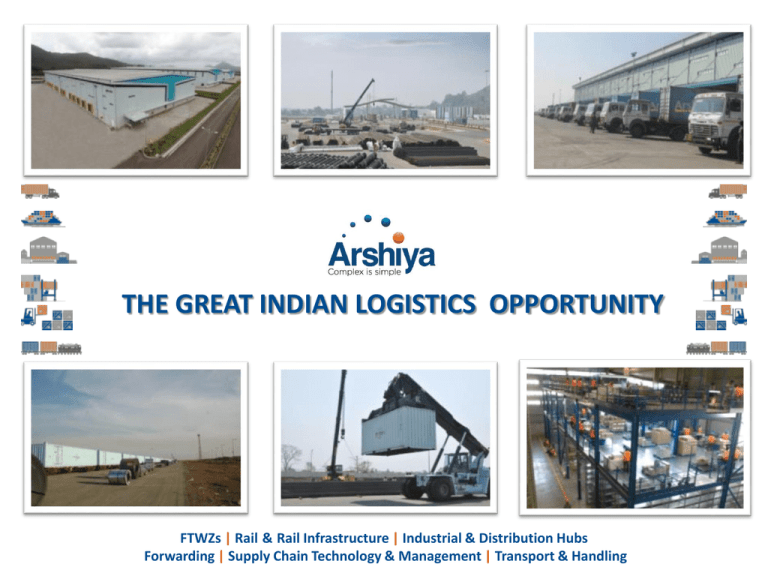
THE GREAT INDIAN LOGISTICS OPPORTUNITY
FTWZs | Rail & Rail Infrastructure | Industrial & Distribution Hubs
Forwarding | Supply Chain Technology & Management | Transport & Handling
INDIA’S GROWING MERCHANDISE IMPORTS
INDIA’S GROWING MERCHANDISE EXPORTS
1.4 %
2%
1.3 %
2.1 %
1.8 %
1.1
%
1%
2007
1.5 %
2008
2009
2007
2010
Export – India’s % contribution to world trade
India’s world ranking in terms of exporting globally consumed
merchandise moved from 26 to 20 during the period 2007 to 2010
60
40
51 %
45.9 %
40
29.6 %
30
30
20
2010
India’s world ranking in terms of importing globally produced
merchandise moved from 18 to 13 during the period 2007 to 2010
50
50
2009
Import – India’s % contribution to world trade
60
51.4 %
2008
20
9.9 %
10
10
0
0
-7.3 %
-10
% Growth of exports (2007-10)
-10
-2.5 %
-9.6 %
% Growth of imports (2007-10)
14
80
% of Penetration
60
50
China's Telecom
penetration in
'05 - 30 %
China's Telecom
penetration in
'11 – 72 %
40
30
20
12.18
India's Telecom 12
penetration in
'11 - 73.3 %
10
70
India's Telecom
penetration in
'05 - 4.8%
8
6
6.91
4
2
10
-
0.78
0.46
2005
2006
2007 2008
China
2009 2010
India
2011
2005
2006
2007
2008
China
India
2009
2010
Per capita consumption
Cement (kg)
Steel (kg)
433
176
Copper (kg)
206
55
Toothpaste (gm)
PV* (per 1000)
500
2.7
451
Aluminum (kg)
227
127
0.5
Paper (kg)
22
9
12
2
% of households across income brackets
2005
High
2
%
High
Upper Middle
7%
Upper Middle
13%
35%
Middle
28%
Middle
Low
62%
Low
Low per capita consumption
Definitions:
High: Above $10k Upper Middle: $5k-$10k
Middle: $2.5k-$5k; Low: Up to $2.5k
2020E
2010
4
%
49%
Demographic drivers
High
10%
Upper Middle
32%
Middle
33%
Low
19%
India Opportunity
*PV: Passenger Vehicles
1970
ONWARDS
1980
ONWARDS
1990
ONWARDS
2000
ONWARDS
2005
ONWARDS
2012
ONWARDS
KEEPING IT
IN THE
FAMILY
INDIA
EMBRACES
TRADE
IT ENABLES
INDIA
A VOICE TO
THE PEOPLE
THE ERA OF
INFRA
WHAT’S
NEXT?
INDIA'S GDP (IN BILLIONS OF USD)
$ 3,500
$ 3,000
$ 2,500
$ 2,000
$ 1,500
$ 1,000
$ 500
$0
1970
1975
1980
1985
1990
1995
YEAR
2000
2005
2010
2015
2020
GDP growth from 2012 assumed
at 6% p.a.
ATTRACTIVENESS OF JAFZA
JAFZA
100% Foreign Ownership
70.1%
50 year zero tax guarantee
46.7%
Proximity to Jebel Ali Port
22.2%
16.2%
Jafza 'brand name' and reputation
Proximity to customers
Proximity to suppliers
Infrastructure offered by Jafza
Easy access to labour supply
JAFZA contributes over 26% of Dubai’s GDP
and generates 160,000 direct jobs by
servicing over 6,400 companies from the
zone and contributes to 25% of Dubai Port’s
container traffic
14.0%
13.1%
10.8%
6.8%
EMPLOYMENT IN JAFZA AND TENANT COMPANIES (2006)
120000
SINGAPORE
Singapore FTZ’s has over 7,000 companies
operate through these zones. Due to FTZs
this island nation has become the gateway to
Southeast Asia & a Global Distribution Hub
for international companies
100000
80000
WAIGAOQIAO
60000
40000
20000
0
1985 1987 1989 1991 1993 1995 1997 1999 2001 2003 2005
Source: PWC report for JAFZA FTZ
Waigaoqiao FTZ in Shanghai has over 9,300
companies registered in the zone, including
135 of the Fortune 500 companies. From an
economically backward country in 1970 to its
gigantic success, FTZs have been the single
most critical macroeconomic factor for
China’s rise
INDIA’S GROWING PPP
INDIA TRAILING IN THE MANUFACTURING SPACE
INDIA INCOMPETENT AS A REGIONAL HUB
1800
Container Throughput (in
millions of TEUs)
1600
1400
1200
1000
800
600
4.1X
400
200
180
160
140
120
100
80
60
40
20
0
163
9
12
28
(source: Mckinsey Report)
0
Year
2005
2010
2015
2020
2025
While Consumption in India will grow in
real terms from USD 378 billion
presently to USD 1.56 trillion by 2025 a
fourfold increase, reality is that :
India ranks 13th in terms of importing
world products, consuming just over 2%
of globally produced merchandise, but
growing @ 35%
While by 2020, India is projected to
have an additional 47 million working
population, almost equal to the total
world shortfall, with an average Indian
age of 29 fuelling our ability to become
a manufacturing mecca of the world,
reality is that:
India ranks 20th as per WTO in terms of
exporting world products contributing
just over 1.4% of globally consumed
merchandise, but growing @ 31%
India's container throughput in CY10
was around 9 million TEU's,
as
compared to Dubai (12 million),
Singapore (28 million) & China (163
million)
Indicating zero penetration to the Value
Addition, Hubbing and Re-Export market
leveraging our cost and skill arbitrage
To/From
Singapore
Consolidation / De-consolidation cargo business constitutes approximately USD
12.47 billion to the GDP and 19.2 million TEUs
30% of this potential translates to USD 3.74 billion to the GDP and 5.76 million
TEUs for INDIA
To/From
Dubai
Consolidation/ De-consolidation constitutes approximately USD 12.08 billion to
the GDP and 6 million TEUs
30% of this potential translates to USD 3.62 billion to the GDP and 1.8 million
TEUs for INDIA
Thus, if India realizes 30% of Dubai’s & Singapore’s cargo volumes it will translate to an additional USD 7.36 billion (INR
36,000 crores) as a direct contribution to India’s GDP & increase container volumes at Indian ports by 7.56 million TEUs
The extended potential will also generate three times additional indirect revenues due to increased
supporting activities and will contribute USD 22 billion (INR 110,000 crores) to India’s GDP
WHAT IS IT ?
GOI Introduces the Free Trade & Warehousing Zones Policy, as part of Foreign Trade Policy (FTP) 2004-2009
Governed by the SEZ ACT,2005 & SEZ Rules,2006 Warehousing zone designated as foreign territory within India
WHAT IS IT INTENDED FOR?
To make India into a global trading hub like China, Dubai and Singapore
ACTIVITIES ALLOWED WITHIN AN FTWZ
Storage
Bagging
Palletization
Handling
Bubble
wrapping
Tagging
Quality
Assurance
Transportation
Packing
Documentation
Labeling
Consolidation
Painting
Repairs &
Maintenance
Washing
Crating
Strapping
Cartonization
Bottling
Cutting
Refurbishment
ENTRY BARRIERS
BUSINESS SCALABILITY BARRIERS
LAND
APPROVALS
RULES
EXPERTISE
SERVICE
CAPABILITY
Min 100 Acres
contiguous
land with
100,000 SqM
built up area
at strategic
locations
Approvals
from State &
Central Govt
(Informal &
Formal
Approval,
Notification)
FTWZ in a
sector specific
SEZ cannot
cater to any
unit outside
the sector
specific SEZ
Expertise in
developing &
operating
FTWZs and in
logistics &
supply chain
activities
Integrating
hard and soft
logistics
infrastructure
to be able to
service clients
pan-India
Offering ‘one throat to catch’ end-to-end unified logistics & supply chain services
to global customers
MUMBAI
FTWZ
MASTER PLAN
165 Acre State-of-Art Facility 24km from JNPT Port featuring:
24x7 On-Site Custom Clearance House
State-of-the-Art Infrastructure with World class Safety, Equipment & Maintenance Facilities
Connectivity to our Pan-India Rail Network accelerating distribution through aggregation at strategic locations
State-of-the-art ICD/CFS facility with superior Safety and Hazardous cargo handling capacity of 10,000+
containers including reefers
FOR EXPORTS
FOR IMPORTS
Flexibility towards end-
Products from India entering the FTWZ
distribution in India
Duty deferment benefits (freeing
up working capital)
duty- payment
Exemption on SAD, VAT & CST on
Hassle-free re-export regulatory /
transportation inside India
Lowered product costs
Foreign exchange transaction
capability
labour
products imported into FTWZ; meant for re-
inside the FTWZ
export out of India
reverse logistics through quality control
before dispatch from India
Exemption from custom and stamp duty on
Excise & VAT) on all activities conducted
Increased efficiency through lowered
Reduced buffer stocks
services availed; including
immediate benefits to suppliers
companies exporting into FTWZ
duty implications
Service Tax exemption on
conducted inside the FTWZ including rental &
Export quotas able to be met for
imports through FTWZ
Service tax exemption on all activities
are treated as deemed export providing
Local Tax Exemption (eg. CST, Sales Tax,
Quality control capability prior to
FOR RE-EXPORTS
Foreign exchange transaction capability
Increasing supply chain efficiencies
Income tax exemption on profit where
applicable
Hassle-free re-export process
Permission of 100% FDI for the set-up of
units by the unit holder of the FTWZ
Ability to leverage India’s cost, skill &
geographic positioning advantage as a hub
(forward & reverse) while enhancing
for regional/global distribution post value
capital cash flow
optimizing activities
Flexibility towards end distribution in India
Duty deferment benefits (freeing up working capital & increasing sales )
Quality control capability prior to duty- payment
Exemption on SAD, VAT & CST on imports through FTWZ
Hassle-free re-export regulatory /duty implications
Reduced buffer stocks
Service Tax exemption on services availed; including transportation inside India
Lowered product costs
Foreign exchange transaction capability
CASE STUDY
BENEFITS OF IMPORTING PRODUCTS
INTO INDIA THROUGH THE FTWZ
(DEEMED FOREIGN TERRITORY)
Rejection after
duty payment
International
Suppliers
Supply of spares
and parts to Dealers
in India for after
sales and service
International
Suppliers
International
Suppliers
Dealers in India
Indian
Ports
India
Manufacturing
Plant
International
Suppliers
International
Suppliers
Dealers in India
Dealers in India
Dealers in India
Rejection after
duty payment
Storage of Spares,
Parts and Components
for after sales & service
post duty payment
Dealers in India
Duty paid storage of spares implicating higher working capital of the supply chain implicating higher cost of
product
Limitations in volume of storage increasing lead time for customer delivery
Higher lead time for client delivery creating customers dissatisfaction (unauthorised spares in the market)
Quality control post duty payment increasing hassle for re-export and therefore cost
International
Suppliers
Rejection without
duty payment
Storage of Spares, Parts
and Components for
after sales & service
without duty payment
International
Suppliers
Dealers in India
International
Suppliers
International
Dealers
FTWZ
International
Suppliers
International
Suppliers
Dealers in India
Rejection without
duty payment
Regional distribution of
spares and parts enabling the
income tax exemption on the
re-export of imported spares
and parts
International
Dealers
International
Dealers
Duty deferred storage reducing working capital and therefore cost of product
Reduction in lead time in supplying the spares for after sales and limitless capability of spares storage
Quality control before duty payment enabling hassle free re-export process and therefore lowering
of associated supply chain costs
Regional Distribution capability leveraging cost/skill arbitrage of India in addition to Income tax exemption
of profits from this activity
Products from India entering the FTWZ are treated as deemed export providing immediate
benefits to suppliers
Local Tax Exemption (e.g. CST, Sales Tax, Excise & VAT) on all activities conducted inside the FTWZ
Export quotas able to be met for companies exporting into FTWZ
Increased efficiency through lowered reverse logistics through quality control before dispatch from
India
Foreign exchange transactions capability
Increasing supply chain efficiencies (forward & reverse) while enhancing capital cash flow
CASE STUDY
BENEFITS OF EXPORTING PRODUCTS
INTO INDIA THROUGH THE FTWZ
(DEEMED FOREIGN TERRITORY)
Reverse logistics of
rejected materials
Breaking and re-invoicing of
units as per different store
demands is conducted before
dispatches to the stores.
Store
1
Supplier 1
Supplier 2
Various
Ports across
India
DC in
Europe
For value
addition
Store
2
Supplier 93
93 suppliers from India ,
Karachi(18) Bangladesh(15),
& Sri Lanka (4)
All the SKUs are sent by
the suppliers directly to DC
in Europe by suppliers
Distribution Center (DC) in Europe maintained only due to invoicing regulatory limitations where
consolidations of products sourced from India is done
Increased supply chain cycle lead time and associated costs
Company’s India trading arm responsible for any under/over invoicing or customs issues with respect to
shipments of suppliers without having any control over process
Quality control currently in European DC causing higher product returns
European DC doing labeling for products made in India/Asian sub-continent
Store
173
Supplier 1
Store
1
Supplier 2
Store
2
Supplier 93
FTWZ
Supplier
in Pakistan
Supplier in
Bangladesh &
Sri Lanka
DC in FTWZ for
Value addition
Store
173
FTWZ removes regulatory limitations of consolidating product from suppliers in India, Sri Lanka, Bangladesh &
Pakistan in Asia
Significant reduction in DC operations costs of India Vs. Europe
Value addition for end-distribution to world-wide stores done in FTWZ in India lowering costs.
Reduction in suppliers working capital due to faster payment cycle
Lowered reverse logistics cost
Enhanced control and efficiency in inventory management - closer to the suppliers
Service tax exemption on all activities conducted inside the FTWZ including rental & labour
Exemption from custom and stamp duty on products imported into FTWZ; meant for re-export out
of India
Income tax exemption on profit where applicable
Hassle-free re-export process
Permission of 100% FDI for the set-up of units by the unit holder of the FTWZ
Ability to leverage India’s cost, skill & geographic positioning advantage as a hub for regional/global
distribution post Value Addition activities
CASE STUDY
BENEFITS OF HUBBING & VALUE
ADDITION OF PRODUCTS IN INDIA
THROUGH THE FTWZ
(DEEMED FOREIGN TERRITORY)
Supply of Charger, Earphone
and packaging material
CHINA
Supply of completely
packaged mobile phones
Indian
Subcontinent
Middle East
Supply of battery
Far East Asia
USA
Supply of handset
GERMANY
Regional Value Addition,
Hubbing & Distribution
Centre in
Singapore/Dubai
VOS like Labelling, packaging, assembly
and consolidation based on the country
of export
South East Asia
Africa/Eastern
Europe
Higher cost of operations in Singapore i.e. Labour, Water, Electricity, Materials etc.
Higher charges for Value Optimising Services (VOS) like labeling, packaging, assembly etc. Increasing cost of
product
Technically skilled manpower expensive and not abundant
Cost of economies of scale
Supply of Charger, Earphone
and packaging material
CHINA
Supply of completely
packaged mobile phones
Indian
Subcontinent
Middle East
Supply of battery
Far East Asia
USA
FTWZ
Supply of handset
GERMANY
VOS like Labelling, packaging, assembly
and consolidation based on the country of
export
South East Asia
Africa/Eastern
Europe
Lower cost of operations in India i.e. Labour, Water, Electricity, Material etc.
Minimum charges for Value Optimising Services (VOS) like kitting, labeling, packaging, assembly etc.
decreasing cost of product
Local tax exemptions (Excise, VAT etc.) on all the value added service inside FTWZ
Abundance of technically skilled manpower
ARSHIYA’S MUMBAI FTWZ
Main Gate
Custom office Entry
Customs Office
Warehouse External View
Container Yard
Stuffing at Container Yard
Docking Area
Docking Area
Cargo storage inside
Warehouse
ARSHIYA’S MUMBAI FTWZ - Over Dimensional Cargo (ODC) Yard
ARSHIYA MUMBAI FTWZ : SNAPSHOTS
Warehouse Internal View
Temp. Controlled Area
VOS Area
Marshalling Area
Server Room
Electrical Sub-Station
Generators for Power Backup
Security System at Warehouse
CCTV Cameras
World-class Warehouses of 13 M height with G+6 palletized racking system, super-flat flooring & state-of-theart Material Handling Equipments (MHEs)
Dedicated & customized Office space & area for Value Optimizing Services (VOS) within the Warehouse
Mezzanine storage area with temperature controlled HVAC system & optional humidity control
Container Yard (CY) with Pavement Quality Concrete (PQC) flooring for stacking containers in a G+5 stacking
system using state-of-the-art Rubber Tyre Gantry Cranes (RTGCs) & Reach Stackers
Maintenance & Repair (M&R) Yard, Scrap Yard & an Empty Container Yard, Food court, Medical dispensary
with Ambulance at site
Open & covered Over Dimensional Cargo (ODC) Yard with Paver-Block flooring for storage of cargo that cannot
be stored in the Warehouse
Business Ancillary Services: On-site Office spaces, Banks, Insurance, Currency Exchanges & CHAs that reduce
operating costs for companies operating in the Foreign Territory
Fire & Safety Amenities: Primary & Secondary fire fighting systems along with Tertiary Fire Engine at FTWZ site
with trained Fire Fighting Professionals. Personnel having expertise & certification in handling DG Cargo
Secure IT Connectivity: Comprehensive IT system with network infrastructure such as server room within each
warehouse & a centralized data center with uninterrupted data, voice & video connectivity & 100% back up
Supporting Infrastructure: Weigh bridge, road network with up to 6 lanes to avoid congestion, Fuel Station in
the processing zone, uninterrupted water & power supply systems & 100% power back-up using DG Sets
Earthquake Resistant & Storm Water Drainage System: Warehouses designed as per Seismic Zone 4
requirements. In addition the FTWZ has a capacity to handle rainfall with peak intensity of 156 mm/ hour or 10
cubic m per sec, i.e. 3 times the highest recorded level of rainfall in Mumbai.
Corporate Social Responsibility: Ambulance and Fire Tender to service not only Arshiya’s FTWZ but also the
residents of the neighboring area
At Arshiya, we believe there is a way to
contribute to the environment, play a
pertinent sustainable role through varied eco
friendly and environment effective measures.
Here’s a look at few :
STP: By way of a sewage treatment plant, recycled
water is used for irrigation purposes
Reutilization of excavated rocks: Excavated rocks
are used for project construction thereby
conserving resources
Green Zone: At Arshiya we ensure that more than
10% of the project area is covered under green
zone along with specific selection of plant species
Natural Lighting & Insulation: Optimum, natural
sunlight presence along with provision for
ambient temperature at the FTWZ Site via
articulate architecture planning/construction
ensures optimal electricity consumption and
ensures harmony at workplace
Rain Water Harvesting: Bore wells, recharge pits
and natural ponds provide for maintenance of
ground water level
Environmental Consciousness: At Arshiya it is
our constant effort to emit no Industrial effluents
and contribute towards maintaining sanctity of
the environment through Waste Disposal Units
FACILITIES & VALUE OPTIMISING SERVICES (VOS) IN FTWZ
STANDARD WAREHOUSE
ODC YARD (OPEN & COVERED)
CONTAINER YARD (CFS)
CHILLER/FREEZER
HAZARDOUS STORAGE
TEMPERATURE CONTROLLED STORAGE
STRONG ROOM
OFFICE INFRASTRUCTURE
VOS ON CONTAINER
VOS ON PALLETS /
BREAK-BULK OF PALLETS
HIGH END VOS
Customs Documentation
Carting & Shifting of the Pallets
Quality Control (QC)
Incoming & Outgoing Transportation
Palletization
Sorting / Assorting
Carbonization
Kitting / De-kitting
Strapping
Bottling/ Blending
Shrink Wrapping
Assembling
Packaging / Re-packaging
Cutting & Threading
(Port to FTWZ & return)
Gate Coordination (incoming &
outgoing)
Survey of Cargo/Containers
(incoming & outgoing)
(into smaller parcels/cases /cartons)
Consolidation
Labeling / Re-Labeling
Agglomeration
Bar-Coding
Repairs & Maintenance
Weighment of Containers
Strapping, refurbishment
CKD/ SKD assembly
Fumigation of Containers
Tagging, shrink / stretch / bubble
Cutting/ Polishing
Handling / Loading & Unloading
(inbound & outbound)
Scanning of Containers
Lashing / Unlashing Services etc.
wrapping etc.
Painting/ Coating
Filming/ Re-sizing
Splitting
Threading
Coupling, etc.
Understanding of client’s business model and Pain areas
Creating consolidated business proposal specific to client’s business model with one price inclusive of all elements
like Transportation to and from FTWZ, Storage, VOS etc..
Pricing strategy based on client’s VOS scope and throughput
Also based on client’s industry standard pricing practices e.g.,
For Steel Industry: Per ton basis
For Wine Industry: Per case/piece basis
For Large Importers and Exporters: Per Container Basis (Movement from Port to FTWZ and back including
storage and all other services)
All above logos are property of respective owners
Sector
Trading (Import & Re-Export)
Product Type
FMCG Products such as Perfumes, Sports Items, Deodrant, Shoes etc.
REVENUE MODEL
Rental
Racked Warehouse Rent
INR 800/pallet
Per Pallet
Per TEU
800
16,000
Value Optimizing Services (VOS)
Comments
Activity
Rate
Per Pallet
Per TEU
Gate Charge (Inbound)
INR 150/TEU
7.5
150
Survey Charges (Inbound)
INR 150/TEU
7.5
150
Handling (Inbound)
INR 100/Pallet
100
2,000
Handling (Outbound)
INR 100/Pallet
100
2,000
Gate Charge (Outbound)
INR 150/TEU
7.5
150
Survey Charges (Outbound)
INR 150/TEU
7.5
150
230
4,600
Total Compulsory VOS
Avg. 20 Pallets/Container
Packaging
INR 20/Carton
200
4,000
Labeling
INR 2/Piece
1,000
20,000
Bar coding
INR 0.50/Piece
250
5,000
Transportation (Inbound)
Rs. 4400/TEU
220
4,400
Transportation (Outbond)
Rs. 4400/TEU
220
4,400
Palletization
INR 500/Pallet
500
10,000
Total Discretionary VOS
2,390
47,800
Total VOS
2,620
52,400
Ratio (VOS Revenue / Rental Revenue)
3.28
No. of Cycle in a month
3
Actual VOS/Rental ratio
9.83
A. 1 Pallet = 10 Cartons
B. 50 pieces per carton
C. Total Cartons/Container = 200
D. Total Pieces/Container = 10,000
In this case all the incoming cargo will be
palletized again for re-export
Per Piece Rate – INR 6.99
34% reduction on current cost for
customer
THE FTWZ REVOLUTIONIZING THE INDIAN LOGISTICS LANDSCAPE
THROUGHPUT
FORWARDING
VOS ON
CONTAINER
RENTAL
RAIL & RAIL
INFRASTRUCTURE
VOS ON
PALLETS
HIGHER END
VOS
INDUSTRIAL &
DISTRIBUTION
HUBS
SUPPLY CHAIN
TECHNOLOGY &
MANAGEMENT
TRANSPORT &
HANDLING
REVENUE FROM UNIFIED SUPPLY
CHAIN INFRASTRUCTURE
SOLUTIONS
REVENUE FROM VALUE
OPTIMISING SERVICES (VOS) ON
CONTAINERS AND PALLETS
REVENUE FROM RENTALS OF
WAREHOUSE, CHILLER/FREEZER,
CONTAINER &ODC YARD, OFFICE
SPACE
LOGISTICS SPEND AS A % OF GDP
Developed Countries
India
14%
9 – 10%
INEFFICIENCIES IN LOGISTICS IN INDIA
Absolute Value inefficiency & market potential of
USD 80 Billion on USD 1.6 Trillion GDP owing to
excess spending on Logistics
India burns nearly USD 2.5 Billion of fuel due to
trucks idling on interstate check-posts
Avg time to clear cargo at ports in Singapore is 3-4
days vs 19 days at ports in India
% of Containerization of
Trade
% OF CONTAINERIZATION OF TRADE
SHARE OF ROAD VS RAIL TRANSPORT
100
90
Road: 65%
80
Rail: 30%
60 - 70%
70
60
50
40
30
25 %
20
Others: 5%
10
0
India
World
An Economies of Scale problem requires an Economies of Scale solution
Free Trade & Warehousing Zones (FTWZs) :
To enable EXIM cargo Consolidation, Value Addition and allow India to become a Regional Trading Hub
Industrial and Distribution Hubs:
For Domestic distribution, cargo value addition and consolidation for Rail transportation to remove dependency
on road
Rail and Rail Infrastructure :
Comprises innovative Customized Containers for specific product types, Service Level agreements on timeline
and deliver with Key Performance Indicators
State-Of-The-Art Rail Terminals, at strategic locations across India with modern equipment to increase speed
of loading/unloading and churn
Unified Logistics & Supply Chain Infrastructure with Supply Chain Technology & Management,
Transport & Handling and Forwarding :
Global ocean & air logistics, domestic forward and reverse supply chain management with ownership on
reduction of working capital and product visibility & control, through technology
ARSHIYA INTERNATIONAL LTD.
Capitalizing on India’s mammoth logistics
opportunity through Unified Supply Chain
Infrastructure & Solutions
Partnering towards
FTWZs with integrated ICD/CFS
Rail and Rail Infrastructure
Industrial & Distribution Hubs
Supply Chain Technology & Management
Forwarding
Transport & Handling
DUBAI
DUBAI
Established in 1985, Jebel Ali Free Trade Zone (JAFZA) is spread across an area of 48 sq kms, with
over 6,400 companies operating in the zone, including 120 of the Fortune Global 500
enterprises
Accounts for 25% of all container throughput at Jebel Ali port & 12% of all air freight at Dubai
International Airport.
Over the years it has created over 1,60,000 direct jobs in the UAE through its companies
Increased its revenue at an average of 34% year-on-year
Contributed to Dubai’s GDP at 25% on a year-to-year basis
Accounted for more than 50% of Dubai’s total exports
Accounted for 20% of all FDI inflow into the UAE
Grown its customer base by over 60% in the last four years
Even with an economy which is purely a transhipment hub, with comparatively low level of
domestic consumption, FTWZ has been a game changer for Dubai
CHINA
CHINA
FTZs are operational since 1980
Waigaoqiao FTZ in Shanghai is spread across an area of 10 sq kms & over 9,300 companies
registered in the zone, including 135 of the Fortune 500 companies
Other zones being - Zhuhai (3 sq kms), Ningbo (2.3 sq kms), Xiamen (5 sq kms),
Futian (1.35 sq kms), Shatoujiao (0.27 sq kms) & Yantian Port (0.85 sq kms)
From an economically backward country in 1970 to its gigantic success, FTZs have been
the single most critical macroeconomic factor for China’s rise
SINGAPORE
SINGAPORE
FTZs were first established in the island nation in 1969, today the entire country is a Free Trade
Zone
Notable FTZs being – Keppel (2.59 sq kms), Pasir Panjang (0.65 sq kms), Jurong (0.61 sq kms),
Sembawang (0.19 sq kms) & Air Logistics Park of Singapore at Changi Airport
Over 7,000 multinational companies operate through these zones
Due to FTZs this island nation has become the gateway to Southeast Asia & a Global
Distribution Hub for international companies
Dubai
Mumbai
Singapore
At present, majority of product hubbing & value addition is done in Dubai & Singapore
70% to 80% of these value additions, is done for products meant for Indian market
Compared to Dubai or Singapore, India is much larger market for product consumption and is an emerging
manufacturing hub
India has tremendous advantages in terms of cost & skill arbitrage vis-à-vis Dubai & Singapore
Due to its strategic positioning, India is much better suited for being a Transhipment , Value Addition & Global
Distribution hub than other economies
India is world’s 2nd largest developing & fastest growing
economy just behind China
With a population of approx 1.1 billion, our domestic
consumption comprises 58% of our GDP
Strategically located between South East Asia & Middle East,
we have 7,000 kms of coastline & unlike China our population
is evenly spread across hinterland
Unlike Dubai, India has a strong manufacturing base where
global companies are producing products for domestic as well
as export opportunities
Logistics infrastructure is the single largest challenge as well
as the biggest opportunity for sustaining India’s fast paced
GDP growth
In-efficiencies due to lack of logistics infrastructure & organized logistics, costs India an additional USD 65
billion per year
In a growing economy if logistics infrastructure doesn’t grow at faster pace than the GDP, it would cost India
very dearly
Indian economy is losing around 1.5% in GDP growth, due to lack of logistics infrastructure
India loses approximately INR 55,000 crores per year of food produce due to lack of logistics infrastructure
North
Central
FTWZ
East
West
Rail Connected, Planned Pan-India
INDUSTRIAL & DISTRIBUTION HUBS
Planned Pan-India, Complimenting
the FTWZ Network
RAIL & SUB HUBS
Planned 150 Train Pan-India Rail Operations
with Rail Terminals at strategic locations
South
18 km from the new Yamuna
Expressway connecting Noida to
Agra
12 km from proposed
international airport at Jewar in
UP
Sikandarabad – the neighbouring
Developed Industrial City is < 30
km from the FTWZ
Tughlakabad – 80 km
Dadri – 60 km
Bulandshahr – 20 km
About 70 km away from the
National Capital Region (NCR)
Khurja Integrated
Infrastructure
Masterplan
315 Acre Comprehensive Facility 90 km from Delhi
Side-by-Side FTWZ (135 Acres - launched in Jan 2012) and Industrial & Distribution Hub (130 Acres)
Arshiya Rail Infrastructure (50 Acres), including on-site Rail Siding
Operations live as of H2FY’12 to be joined by similar models in Central, South & East
State-of-the-art ICD/CFS facility with superior Safety and Hazardous cargo handling capacity of 10,000+ containers
including reefers
ARSHIYA’S KHURJA FTWZ
RAIL INFRASTRUCTURE: SETTING THE PACE OF GROWTH
Mode Share (percent of Ton-Km)
Share estimated for 2007 excluding pipelines
100% =
5,275
billion ton-km
5,930
billion ton-km
1,325
billion ton-km
1%
1%
1%
100
90
%
%
14 %
30 %
%
48 %
60
50
%
36 % %
80
70
6 %
Air
Waterways
47%%
40
57 % %
30
20
10
Freight Transport in
India is dominated
by road
Rail
Road
37 %
22%
%
0
China
US
India
…. shows India’s high dependency on roads as compared to US/China who have
developed rail infrastructure ….
Network
length
Freight
Tonne
carried
Tonne Kms
(Km)
(Millions)
(Millions)
USA
226,706
1,775
2,820,061
23,990
India
63,327
728
480,993
China
China
63,637
63,637
2,624
2,624
Russia
84,158
1,344
Country
Freight
Lead
NTKM/
Employee
NTKM/
Route
Length
NTKM/ Wagon/
Day
(Km)
(Millions)
(Millions)
(Millions)
475,416
1,589
15.08
12.44
16,251
8,110
207,719
661
0.34
7.60
6,344
2,211,246
17,222
571,078
843
1.07
34.75
10,608
2,090,337
12,063
566,802
1,555
1.85
24.84
10,104
No. of
Locos
No. of
Wagons
With almost same network length as India, China was carrying more than 4 times India’s Tonnage.
The real parameter is NTKM or Tonne –Km (Tonnes multiplied by Km travelled). In utilizing the network, China was 5 times more efficient
and Russia was 4 times more efficient. (Ton-Km divided by Network Length)
As far as wagon efficiency is concerned (Tonnage carried X Distance carried), China is 67 % more efficient than India and USA is 150 % more
efficient than India.
China’s ratio of Wagons to Locomotives is worse than India (33 against 25), still it had better wagon utilization efficiency.
…. showed India’s railway network was not as efficiently utilised as China and therefore prompted policy changes.
BACKGROUND AND OPERATIONS
Acquired Category I pan-India rail license in
2008, permitting it to transport containerized
cargo throughout India
Provides pan-India customized container rail
freight movement, and rail terminal services and
facilities for transporting domestic and EXIM
cargo
Currently has 20 rakes, 4,500 containers and a
rail terminal siding at Khurja (New Delhi)
#1 Company in the domestic container segment;
#2 PCTO in terms of number of operational
rakes
SCOPE OF OPERATIONS
EXISTING ROUTES
PROPOSED ROUTES
Batala Sahnewal
Ahmedgarh
Loni
Patli
Nawa City ACTL-Faridabad
Ahmedgarh
Bilaspur Road
Faridabad
Khurja
Durai
Jogbani
Guwahati
Morbi
Morbi
Sanand
Rourkela
Kolkata
Jharsuguda Haldia
Chalthan
Mumbai
Lonand
Mundra
Sanand
Pipavav
Mumbai
Malanpur Jamshedpur
Lapanga
Haldia
Nagpur
Vizag
Vizag
Chennai
Bangalore
Bangalore
Milavittan
Guwahati
Kolkata
Cochin
SELECTED CLIENTS AND AWARDS
2012: Private Train Operator of the Year - 2nd Indian
Supply Chain & Logistics Excellence Awards 2012
2011: Private Rail Operator of the Year – Gateway
Excellence Awards: Supply Chain Management &
Logistics
Private Rail Operator of the Year, Domestic
Cargo – Maritime and Logistics Awards
PCTO of the Year – 5th Express Supply Chain and
Logistics Award
Rail Operator of the Year – Gateway Media
Open top containers increasing speed of
loading heavy cargo
Customized Containers for Steel Cargo
Enhanced Security Arrangement
Multi-purpose containers for
increasing return utilization
dry-cargo
Enhanced cargo locking facility inside the
containers
Customized containers for carrying various
types of cargo
Customized Solutions (Auto Shipments)
FREE TRADE & WAREHOUSING ZONES
TRANSPORT & HANDLING
Implementation and
operations of Free
Trade &
Warehousing Zones
(FTWZs)
First and last mile
domestic
transportation
services
RAIL AND RAIL INFRASTRUCTURE
Customized and
Chartered Pan India
Rail Freight services
and state-of-the-art
Rail terminal
facilities
SUPPLY CHAIN TECHNOLOGY &
MANAGEMENT
INDUSTRIAL AND DISTRIBUTION HUBS
Strategically located
warehousing hubs
and rail consolidation
across India
Provides end-to-end
supply & demand
chain solutions
FORWARDING
Logistics solutions
including end-to-end
freight management
& transportation
services in over 150
countries worldwide
GROUP FINANCIAL HIGHLIGHTS
Revenue
164%
EBITDA
PAT
EBITDA Margins
166%
428%
19.4
16.4 %
14.6 %
12.8 %
%
FY08 FY09 FY10 FY11 FY12
FY08 FY09 FY10 FY11 FY12
Consolidated Highlights
FY 2008
FY 2009
Operating Income— ₹ Cr.
401.2
503.0
EBITDA — ₹ Cr.
51.4
73.5
12.8%
14.6%
45.4
EBITDA MARGIN %
PAT — ₹ Cr.
PAT MARGIN %
EPS — ₹ per share
FY08 FY09 FY10 FY11 FY12
FY 08FY 09FY 10FY11 FY12
FY 2011
FY 2012
H1FY13
525.9*
821.5
1057.3
714.4
86.1*
159.2
271.6
201.6
16.4%
19.4%
25.7%
28.2%
65.6
98.3
82.0
120.8
70.1
11.3%
13.0%
18.7%
10.0%
11.4%
9.8%
9.7
11.3
16.7
13.9
20.5
11.9
Financial Year ending 31 Mar
* Excluding income from sale of software marketing rights at ₹ 38.89 cr
FY 2010
25.7
%
Q2 FY 2011
Q2 FY 2012
` 195.05 Cr.
Q2 FY 2013
` 247.96 Cr.
` 372.57 Cr.
FTWZ
FTWZ
Rail
Others
24
%
16%
21
%
51
%
Rail
24%
78
%
Forwarding
60%
Others
H1 2011
Rail
Forwarding
Forwarding
H1 2012
`372.00 Cr.
H1 2013
` 470. 56 Cr.
` 714.41 Cr.
FTWZ
FTWZ
23
%
15%
Rail
19
%
Others
Rail
52
%
23%
80
%
62%
Rail
25
%
Forwarding
Others
Forwarding
25
%
Forwarding
66
Project (` in crore)
Debt
Equity
Total
O/s debt
Panvel FTWZ – Phase I & II
850
329
1179
850
Khurja FTWZ – Phase I
259
270
529
259
Rail Infrastructure
400
341
741
360
Khurja Industrial & Distribution Hub
399
249
648
399
1908
1189
3097
1868
Total
Notes (Not included in table above):
1. Total Debt including non-project loans and working capital loans is Rs. 2430 crore.
2. Company has invested ₹ 93 crore as equity in Arshiya Central FTWZ (Nagpur) for land acquisition
purpose.
3. Company has also invested equity of ₹ 112 crore in Khurja FTWZ Phase II
2012
Supply Chain Visionary of the Year
2012
CFO 100 Roll of Honour 2012
Best ELSC Logistics Infrastructure
Company of the Year 2012
2nd Shine Awards 2012
Best Managed Company
in India 2012
Institute of Public Enterprise (IPE)
HR Leadership Awards 2012
Private Train Operator of the
Year 2012
2011
Leading Business Woman
of the Year 2011
Best Rail Operator
of the Year 2011
SAP ACE 2011 –
SAP Implementation Award
Private Rail Operator
of the Year 2011
Private Container Rail Operator of
the Year-Domestic Cargo 2011
Achievement Award for Best ProjectUrban Infrastructure (2011)
THE ARSHIYA TEAM
Ajay S Mittal
Archana Mittal
Group Chairman and
Managing Director
Joint Managing
Director
Sandesh Chonkar
Executive Director
11th JANUARY, 2O12
6TH JANUARY, 2O12
Delivered with ready state-of-the-art
hubbing and rail infrastructure
The FTWZ claiming business from
other regional hubs like Dubai and
Singapore
Ten year services legacy leveraged
with infrastructure offering a ‘one
stop shop’ logistics solution for
customers
Fully unified logistics and supply
chain delivery capability
Rightly positioned to enable and
capitalize on India’s growth
Corporate HQ: 301 Ceejay House, Level 3, Shiv Sagar Estate, F-Block, Dr. Annie Besant Road, Worli, Mumbai - 400 018. Maharashtra, India.
Ph: +91 22 4230 5500 /1 /2 Fax: +91 22 4230 5555
Registered Office: Arshiya House, 3rd Floor, Plot No.61, Road No.13, M.I.D.C., Andheri (East), Mumbai - 400093,Maharashtra, India.
Ph: +91 22 4048 5300
For more info please write to us at:
info@arshiyainternational.com
Copyrights © , All Rights Reserved. Arshiya International Ltd
www.arshiyainternational.com

