Michael McMullen
advertisement
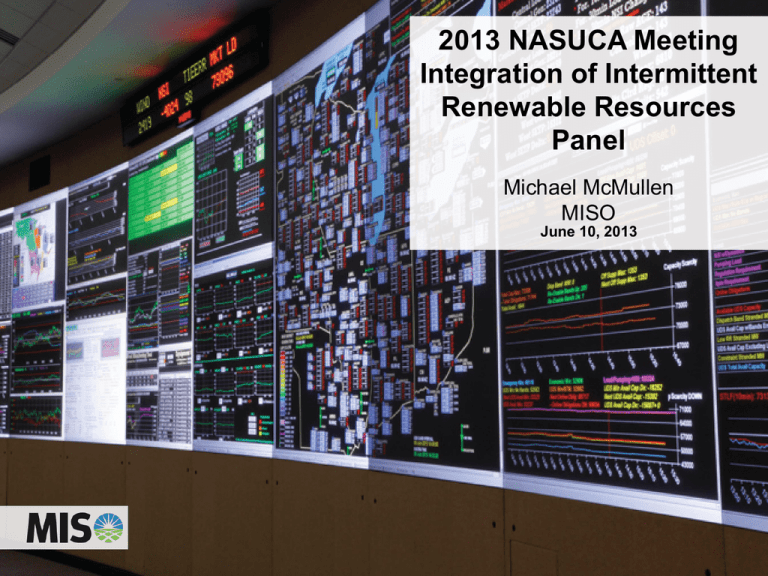
2013 NASUCA Meeting Integration of Intermittent Renewable Resources Panel Michael McMullen MISO June 10, 2013 0 MISO is one of the largest and most technologically advanced grid operators in the world Current MISO MISO w/ Entergy High Voltage Transmission - miles 49,670 65,170 Installed Generation MW 132,296 162,296 Installed Generation # of Units 1,259 1,431 Peak System Demand - MW 98,576 133,576 1 MISO’s role is focused on a few key value-added areas What We Do Implications Provide independent transmission system access • Equal and non-discriminatory access Deliver improved reliability coordination through efficient market operations • Improved regional coordination Coordinate regional planning • Compliance with FERC requirements • Enhanced system reliability • Lowest cost unit commitment, dispatch and congestion management • Integrated system planning • Broader incorporation of renewables • Market price / value discovery Provide price information transparency • Encourage prudent infrastructure investment • Provide wholesale alignment for retail policy implementation 2 MISO was formed to address federal requirements, but growth has been based on value creation 2013 • Entergy Region 3 MISO’s capacity is comprised primarily of coal and natural gas units… Nuclear (6%) Biomass (3%) Other (2%) Renewables (14%) Hydro (30%) Gas / Oil (32%) MISO Nameplate Capacity 132,296 MW MISO Nameplate Capacity – Renewables 18,734 MW 4 …but wind resources are growing rapidly Registered nameplate wind capacity in the MISO region (in MWs) MISO RPS Mandates by 2021 = ~20,770 MW ACTUALS FORECAST 5 Wind’s rapid growth is fueled by MISO’s rich wind resource base... Annual Average Wind Speed at 80 m 6 Source: Wind resource estimates developed by AWS Truepower …and renewable portfolio standards and goals adopted in MISO states MN ND 10% by 2015 MT 15% by 2025 SD 10% by 2015 Xcel: 30% by 2030 25% by 2025 WI 10% by 2015 MI 10% by 2015 IA 105 MW IN IL 25% by 10% by 2025 2025 MO 15% by 2021 KY No RPS State with RPS Mandate State with RPS Goal State with RPS Mandate or Goal MISO Existing Wind = 12,270 MW MISO RPS Mandates by 2021 = ~20,770 MW 7 Source: MISO, DSIRE – Database of State Incentives for Renewables & Efficiency 7 Inherent characteristics of wind have significant operational impacts on MISO Driver • Variability of wind • Poor correlation of wind and load • Transmission congestion caused by wind location Market Issue Tools • Congestion management • Market dispatch of intermittent units (DIRs) • Over and under commitment • Enhanced wind forecasting • Ramp management • Surplus generation events • Future ramp capability enhancement 8 Wind is variable by month… Monthly Energy Contribution from Wind (in GWh) 3,874 3,463 3,267 3,073 3,053 2,923 3,036 2,909 3,138 2,339 2,058 1,481 Apr-12 May-12 Jun-12 Wind Energy as a % of MISO Energy 9.5% 7.9% 5.8% 1,644 Jul-12 Aug-12 Sep-12 Oct-12 Nov-12 Dec-12 Jan-13 Feb-13 Mar-13 Apr-13 3.2% 4.0% 5.9% 9.3% 8.5% 7.4% 9.4% 8.1% 8.0% 9.8% Source: MISO Real-Time Operations and Transmission Asset Management Departments Source: MISO Monthly Operations Report for the Informational Forum, April 2013 9 …and wind is variable day-to-day and doesn’t reliably correlate with load Daily Wind Capacity Factor % for Peak Hours 1/1/2013 – 4/30/2013 80 60 40 20 0 Jan-13 Feb-13 Mar-13 Apr-13 Note: Weekends and holidays are considered off-peak and are excluded from the graph. 10 Source: MISO Monthly Operations Report for the Informational Forum, January 2013 - April 2013 Improved wind forecasting will allow for improved operations, but wind forecasting is not likely to become an exact science MISO Forecasting Accuracy: 1/1/2012 – 5/13/2013 Day Ahead 4 hours Ahead Hour Ahead Standard Deviation 765 MW 612 MW 486 MW Mean Absolute Error 587 MW 476 MW 390 MW Mean Absolute Percentage Error 5.3% 4.3% 3.5% 11 Challenges prior to MISO dispatching intermittent resources (DIRs) • Rapid increase in wind penetration – Transmission expansion lagged wind expansion – Deployment in areas with little transmission – Increasing need for manual curtailments to manage congestion • Challenges of manual curtailments – Highly manual process; time consuming for reliability coordinator – Tracking firm vs. non-firm transmission service – Manual curtailments not accounted for in security constrained economic dispatch resulting in loss of price transparency – Manual curtailments less economic than automated security constrained economic dispatch – Adverse settlement impacts on wind participants 12 Dispatchable Intermittent Resources (DIRs) design features • Renewable generation is treated like any other generation resource in the market • DIRs can participate in the real-time energy market • DIRs can automatically be dispatched up to a forecasted limit based on an offer price and system conditions. – Participants submit a short term wind forecast instead of a hourly economic maximum like other generation resources – This enables wind to submit offers and receive dispatch instructions rather than be manually curtailed when transmission constraints limit renewable energy generation to reach the broader market region Dispatchable Intermittent Resources enhance system wide operational and market efficiency and improve market transparency 13 Dispatchable Intermittent Resources (DIRs) registration • DIRs launched on June 1, 2011 • Registration required as of March, 2013 with limited exceptions 11,857 10,680 10,601 12,444 12,270 12,238 10,791 9,758 9,523 1,208 Jun 2011 Jun-11 2,037 Sep 2011 Sep-11 3,290 Jan 2012 Jan-12 4,024 Mar 2012 Mar-12 Wind Nameplate Capacity (MW) 4,826 Jun 2012 Jun-12 6,084 6,283 Sep 2012 Sep-12 Dec 2012 Dec-12 Mar 2013 Mar-13 Wind Nameplate Capacity (MW) Registered as DIRs 14 MISO is able to capture ~95% of wind’s potential through economic dispatch DIR Dispatched Energy (Left Axis) DIR Dispatch Below Economic Maximum (Left Axis) % of DIR Dispatched Down (Right Axis) 15 Wind variability has the potential to create a ramping challenge which may require improved tools and new market products to manage • The current wind variability and profile impact ramp requirements as significantly as net scheduled interchange – Wind capacity levels expected from the region’s Renewable Portfolio Standards will dramatically increase the operational difficulties – However, MISO’s large balancing area and geographic diversity help minimize the issue at current wind penetration levels • Current operational methods to manage this ramp include – Load and wind forecasting – Pre-commitment of units – Use of fast-start units and spinning reserves to manage unexpected variability • Improved operational and market methods under development – Improved load and wind forecasting – 30-minute reserve products – Ramping service product 16 MISO’s regional planning enables more economic placement of wind resources in the region Local design of wind generation build-out Combination design of wind generation build-out ILLUSTRATIVE Local Design = Renewable energy requirements and goals will be met with resources within the same state as the load Combination Design = Renewable energy requirements and goals will be met with a combination of local resources and resources outside of the state with high ranking renewable energy zones The economic benefit of optimizing wind into MISO’s footprint is $244 to $285 million in annual benefits 17 Source: MISO’s 2012 Value Proposition Study which was based on the results of the Regional Generation Outlet Study II
