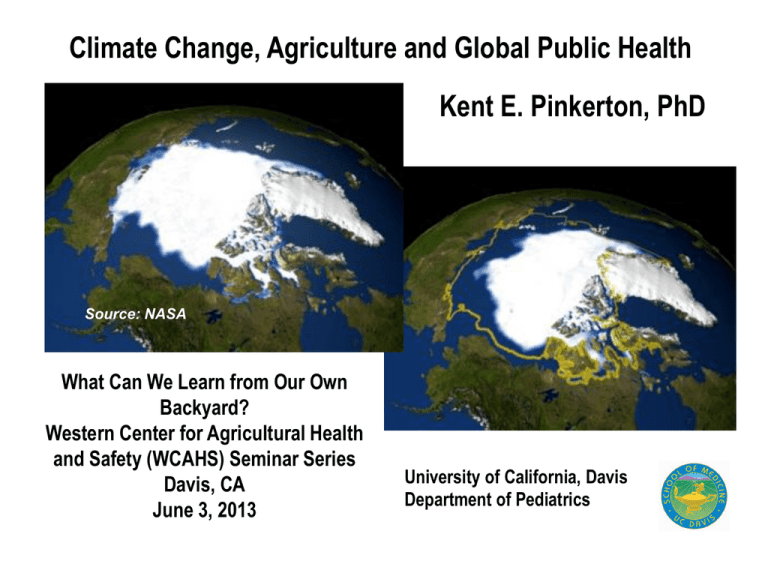
Climate Change, Agriculture and Global Public Health
Kent E. Pinkerton, PhD
Source: NASA
What Can We Learn from Our Own
Backyard?
Western Center for Agricultural Health
and Safety (WCAHS) Seminar Series
Davis, CA
June 3, 2013
University of California, Davis
Department of Pediatrics
IPCC4th AR Global T increase 1.4F
Our Climate is Changing Rapidly
UN World Meteorological Organization, March 2012 announcement of
Global Temperature summary: The World is getting hotter…….
“The rate of increase since 1971 has been “remarkable” according to
the preliminary assessment.”
3
Climate Change and Africa
Malawi
BLANTYRE
Stephen Gordon, MD, Liverpool School of Public Health
Village life is simple
Climate related problems in village life
• Seasonal hunger
• Every year
• Hospital impact
• Flooding
• Common and destructive
• Crop loss
• Drought
• Crops, also safety of water
• Stealing and violence
• Field guards
• Seasonal malaria
• Falling incidence
• Ethiopian micro-dams
Queen Elizabeth Central Hospital
Limited staff, supplies, diagnostic tests and treatment
Limited space, staff, treatment and tests
Climate-related health issues in hospital
• Malnutrition
• Anaemia
• Susceptibility to pneumonia
• Short life expectancy
• Cholera
• Water system in Blantyre
• Plague
• Migration from Mozambique
But these overwhelmed
by HIV and TB
Issues not seen in hospital
• Migration
• War
• Population stress
Angola, Chad, Darfur, DRC, Eritrea, Mozambique, Sierra Leone,
Somalia, Sudan, Uganda, Zimbabwe….
Climate data - Africa
Despite covering a fifth of the world's total land area,
Africa has the worst climate observation system of all
continents, and one that is in a deteriorating state.
About one in four weather stations in east and southern
Africa that are part of the international data-sharing
network called the Global Climate Observing System
are not working, and most of the remaining stations are
not functioning properly.
Meanwhile, the density of the continent's weather
stations is of one per 26,000 square kilometres, eight
times lower than the WMO's minimum recommended
level.
Mechanisms that link climate change
to health, morbidity and mortality
• Direct impacts of climate change,
weather, and sea level rise on humans
• Impacts of climate change on physical
and chemical agents
• Impacts of climate change on biological
agents
• Impacts of climate change and sea level
rise on fundamental life support
Climate-health linkages
• Direct impacts of climate change, weather, and sea level
rise on humans
– Heat stress
– Weather-disease curves
– Storms, weather extremes
• Impacts of climate change on physical and chemical agents
– Air pollution effects
– Fate and transport of toxic chemicals
– Ozone depletion interactions
Climate-health linkages
• Impacts of climate change on biological agents
– Microbes (including algae)
– Plants (pollens, poisons)
– Zoonoses, including VBD’s
• Impacts of climate change and sea level rise on
fundamental life support
– Water availability
– Food/crop productivity
– Shelter
Heat-Related
Morbidity
and Mortality
• Extreme heat causes more
deaths in US than all other
extreme events combined
• Risk factors: age, housing,
urban residence, social
isolation, underlying
disease
• Impacts on co-morbidity a
research priority
• Decline in cold-related
death not expected to
offset increase
Background: Motivation for Climate Change
Concern in California
In July 2006, California experienced a heat wave of unprecedented
intensity and geographic extent – affecting the entire State.
Coroners attributed 140 deaths to hyperthermia, and estimates from vital
statistics data indicate > 650 heat-related deaths may have occurred over
a 17-day period (July 14-30). Estimates of excess morbidity indicate
there were ~1,200 hospitalizations and >16,000 Emergency Department
Visits during the heat wave.
Fewer cold- and heat-related deaths in past 30 years (in US).
Attributed to higher % of homes with central heat & air conditioning.
The public health burden of heat-related mortality and morbidity
remains large, and unacceptable as heat-related illness is mostly
(if not always) preventable.
2006 California Heat Wave: Coroner’s Case Reports
Central Valley
Southeast Desert
SES: 99% of cases lived in zip codes where
> 50% of residents live below Poverty line
Sex: Male
66%
Race/Ethnicity (Classic Heat Stroke cases):
White non-Hispanic: 63 referent
Hispanic:
24 OR: 1.9 (1.2, 2.9)
Black, non-Hispanic: 12 OR: 1.8 (1.0,23.2)
Asian/Pacific Islander: 1 OR: 0.1 (0.01,0.8)
Unknown Race:
19
Age Distribution:
Male (n= 92)
Mean = 61.7 (10 – 98) yrs
Female (n=47) Mean = 73.3 (45 – 98) yrs
Hispanics: trend to be in younger age-groups
Lived alone (43%)
And of those who lived alone and had a social
contact, only 40% were “checked on” within 24
hours prior to death.
AC: 1 reported to be using AC prior to death.
No AC, or not reported
74%
Not functional
13%
Functional but not used
13%
Trent, R.B., et al., Review of July 2006 Heat Wave Related Fatalities in California, available at:
http://www.cdph.ca.gov/HealthInfo/injviosaf/Documents/HeatPlanAssessment-EPIC.pdf.
Climate Change: Past, Present, Future Heat Exposure Potential
California Climate Change Scenarios Project
Dan Cayan et al., 2008, A. Gershunov et al., 2009
Predicted change over 21st Century:
Average temperatures: > increase in summer vs. winter
July-September ↑ in range of: 1.5°C–6°C (2.7°F–10.8°F)
(Depends on the GCM and GHG emissions
scenarios.)
Relative to historical average temps… > warming inland as
compared with coastal regions (within ~50 km of coast)….
”…as much as 4°C (7.2°F) higher…”
Heat Waves: ↑ in frequency: Individual events -↑ tendency for longer duration
> spatial footprints (multiple population centers affected)
Greatest magnitude events:
more humid → less nighttime cooling.
Proportionately more extreme temperatures inland.
Source: IPCC Climate Change 2007: The Physical Science Basis
Historic California temperature data courtesy of: Richard Medina, University of Utah,
Dept. of Geography, Salt Lake City, Steven LaDochy, California State University,
Los Angeles, & William Patzert, Jet Propulsion Lab, NASA, Pasadena, CA.
Climate Change: Vulnerability: Scale is Critical
Geographic Variation in Potential Risk Factors: Higher Spatial Resolution Critical for
County, Local, & Subpopulation Perspectives
Maps created by Zev Ross
Climate Change: Simultaneous Hazards & Risks
Geographic Variation in Potential Risk Factors:
County, Local, & Subpopulation Perspectives
Subpopulations,
Individuals
0 to 50
GOOD
U.S. EPA Ozone (8-hr standard) Air Quality Index (AQI)
101 to 150
51 to 100
151 to 200
201 to 300 VERY
UNHEALTHY FOR
MODERATE
UNHEALTHY
UNHEALTHY
SENSITIVE GROUPS
Ozone Movie Courtesy of Sacramento Air Quality Management District and Sonoma Technology, Inc., Petaluma, CA. (www. sparetheair.com)
SHRINKING ARCTIC ICEPACK
l
l
Arctic ice has lost 40% of
its volume in three
decades.
Chance of this occurring
secondary to natural
cycles is <0.1%.
Breakup of Larsen B Ice Shelf on Antarctic Peninsula January - March 2002
Provided by the National Snow and Ice Data Center.
Increased Occurrence of Bleaching of Coral Reefs
• In 1997-8, 16% of the world’s
reef building corals died due
to El Nino increase in sea
surface temperatures.
• Impact of thermal stress on
reefs can be due to ocean
acidification pH 8.16 to 8.05
from carbonic acid due to
increasing CO2.
Cause and effect: Climate change may have caused the pine-beetle catastrophe.
Climate Change Will Increase Wildland Fires
CA Climate Action Team, 2009 Report:
“An increase in the number, size and
duration of fires will add to the air
pollution that already burdens
California.”
Risk of large wildfires:
– up to 55% increase by 2050
– up to 128% increase by 2099
Wildland fires cause increased
health care utilization for
respiratory illness, especially
asthma.
26
Climate Change: The Evidence is Mounting
March 2012: Hottest March ever
recorded in US (NCDC)
July 2012: Hottest July ever recorded
in US (NCDC)
o Hottest month out of last 1,400
months dating back to 1895
2012 Drought: most extensive US
drought since 1950s
o 80 percent of agricultural land in US
affected (USDA)
o Colorado and Wyoming had the
hottest summer on record (NOAA)
o Nebraska and Wyoming had the
driest summer on record. (NOAA)
27
Respiratory Health Effects of Climate Change
Source: American Lung Association in California
Land Use, Climate Change and Public Health Issue Brief, 2009
28
Heat Waves
• August 2003 heat wave in France. Mean maximum temperature exceeded
the seasonal norm by 11-12ºC on 9 consecutive days.
• 15,000 excess deaths were observed in France (60% increase of expected
mortality) and 32,000 throughout Europe.
• Mortality was age-related. It was 45% higher in women than in men >45
years. Increased mortality in widowed, single, and divorced people.
• Excess mortality at hospitals (42%), home (32%) and in nursing homes (19%).
Lack of air conditioning important cause.
• Significant increase in deaths related to heatstroke, hyperthermia, and
dehydration; heart failure, chronic respiratory, and stroke also markedly
contributed to the mortality. Psychiatric disorders, especially depression, had
increases.
• Dhainaut J-F, et al Critical Care 2004; 8:1-2. Stafoggia M et al Epidemiology
2006; 17: 315-23.
30
Ozone Increases with Higher Temperatures
31
Black Carbon and Climate Change
Black carbon (BC) is emitted directly as a
result of incomplete combustion of fossil
fuels and biomass. Leads to climate
warming by: Absorbing incoming and
reflected sunlight in the atmosphere;
Darkening clouds, snow, and ice thereby
reducing albedo; and Changing
precipitation and cloud patterns.
32
BIOMASS AND HUT LUNG
• Asia, Africa, Latin America, indoor air pollution caused by burning
biomass (branches, wood, dung, charcoal) and coal over primitive
stones occurs in millions of homes.
• WHO estimates 1.9M premature deaths/year from indoor air pollution
(twice that from outdoor pollution). 9.8M by 2030.
• Nearly half the people in the world use polluting inefficient stoves to
cook their food each day: 3B people use biomass – 10% of global energy
consumed. 80% of domestic energy consumption in India.
• 4th in developing countries’ burden of disease.
• Hut Lung in women and pneumonia in children. High incidence of lung
cancer in Chinese women.
• 6.7B tons of carbon by 2050 in Africa (cumulative); 6% of Africa’s total.
• Global Alliance for Clean Cookstoves is a new public-private partnership
with a goal of 100M homes to adopt clean and efficient stoves and fuels
by 2020.
• Medicine 2000; 79: 310-7.
Bronchoalveolar lavage cells with anthracotic pigment
within the alveolar macrophages (X400).
A Human Health
Perspective on
Climate Change:
A Report
Outlining the
Research Needs
on the Human
Health Effects of
Climate Change
American Thoracic Society
Workgroup Paper, March 2012:
Climate Change and Human Health
“…evidence is increasing that climate change does
drive respiratory disease onset and exacerbations…”
"Our greatest concern is infants, children, the elderly and other sensitive
populations," he said. "They will be the first to experience serious climate
change-related health problems.“
Dr. Kent Pinkerton, UC Davis, Workgroup Co-Chair
Thank You!
37
Acknowledgements
• John Balmes, MD; UCSF/UC Berkeley
• Stephen Gordon, MD; Liverpool School of
Tropical Medicine, UK
• Helene Margolis, PhD; UC Davis Medical
Center
• William Rom, MD; New York University
• Marc Schenker, MD; UC Davis, Western Center
for Agricultural Health and Safety
Health Effects of Climate Change
• Heat-related illness and death
• Exacerbation of respiratory disease (e.g.,
asthma)
• Increased cardiopulmonary mortality
• Increased pollen season so increased
respiratory allergic reactions (e.g., asthma)
40
Global Warming’s Terrifying New Math
•Bill McKibben (350.org) has endorsed three critical numbers: 2°C as the
acceptable amount of global warming agreed to as the Copenhagen
Accord signed by 167 countries responsible for more than 87% of the
world’s carbon emissions.
•Scientists estimate we can emit 565 gigatons of CO2 into the atmosphere
by 2050 and still stay below 2°C. In 2011 we emitted 31.6 gigatons and
emissions are increasing 3%/year reaching the limit in 16 yr.
•Carbon Tracker Initiative states that all of the oil, gas and coal companies
have 2,795 gigatons C in their combined reserve proprietary databases.
This is valued at $27 trillion (if we stayed at 565 gigatons, approx. $20
trillion would have to be written off).
•ATS Workshop Report: Climate Change and Human Health. PATS 2012;
9: 3-8.
•Bill McKibben. Global Warming’s Terrifying New Math. Rolling Stone Aug
2, 2012.
Temperature increase is due to Greenhouse Gases

