Age adjustment
advertisement
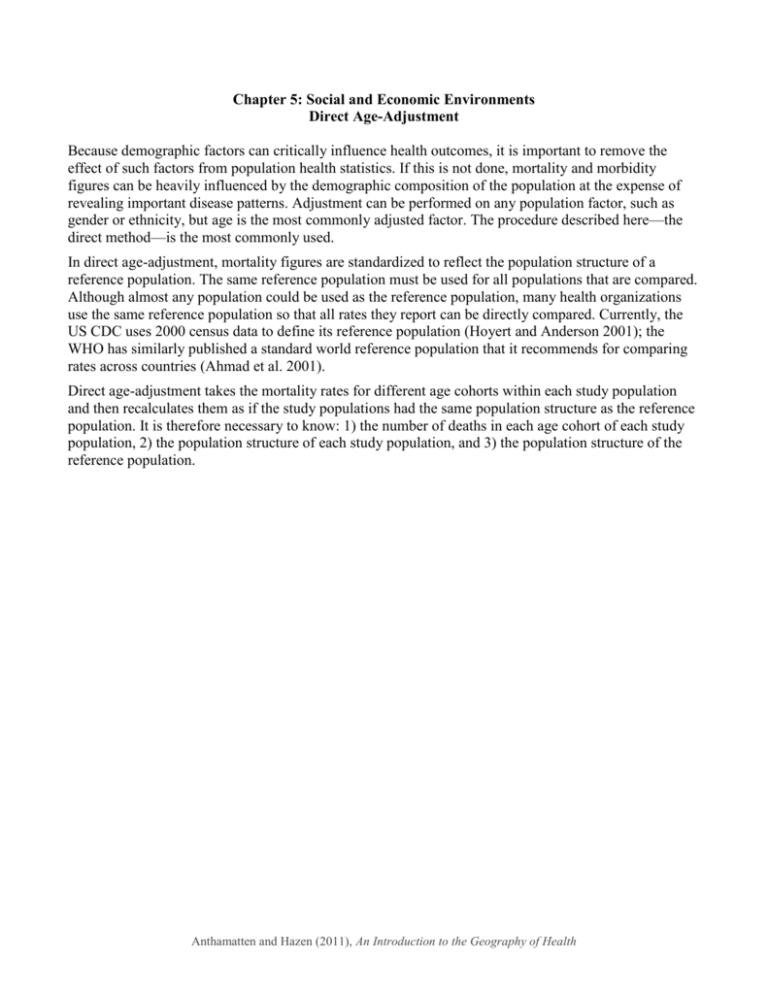
Chapter 5: Social and Economic Environments Direct Age-Adjustment Because demographic factors can critically influence health outcomes, it is important to remove the effect of such factors from population health statistics. If this is not done, mortality and morbidity figures can be heavily influenced by the demographic composition of the population at the expense of revealing important disease patterns. Adjustment can be performed on any population factor, such as gender or ethnicity, but age is the most commonly adjusted factor. The procedure described here—the direct method—is the most commonly used. In direct age-adjustment, mortality figures are standardized to reflect the population structure of a reference population. The same reference population must be used for all populations that are compared. Although almost any population could be used as the reference population, many health organizations use the same reference population so that all rates they report can be directly compared. Currently, the US CDC uses 2000 census data to define its reference population (Hoyert and Anderson 2001); the WHO has similarly published a standard world reference population that it recommends for comparing rates across countries (Ahmad et al. 2001). Direct age-adjustment takes the mortality rates for different age cohorts within each study population and then recalculates them as if the study populations had the same population structure as the reference population. It is therefore necessary to know: 1) the number of deaths in each age cohort of each study population, 2) the population structure of each study population, and 3) the population structure of the reference population. Anthamatten and Hazen (2011), An Introduction to the Geography of Health In the following example, we calculate the direct age-adjusted mortality rate for England and Wales in 2006 (the crude mortality rate for this population is 945 per 100,000). We first calculate age-specific mortality rates by dividing the number of deaths in each age group in 2006 by the total population in those age groups during the same year. The results are then usually expressed per 100,000 people. For example, among 0-4 year olds, there were 3,930 deaths out of a total population of 2,488,142 in that age group. We therefore divide the number of deaths (A) by the population (B) and multiply the result by 100,000, yielding an age-specific mortality rate of 157.9 per 100,000 (C). 0-4 5-14 15-24 25-34 35-44 45-54 55-64 65-74 75-84 85+ England and Wales, 2006 (A) (E) Number of (B) (C) (D) Weighted Deaths Population Rate / 100,000 Reference Pop. Rate 3,930 2,488,142 157.9 0.0886 14.0 760 6,572,222 11.6 0.1729 2.0 2,870 7,051,638 40.7 0.1669 6.8 4,510 7,055,315 63.9 0.1554 9.9 10,120 8,207,854 123.3 0.1374 16.9 20,400 6,912,149 295.1 0.1141 33.7 45,500 6,332,792 718.5 0.0827 59.4 83,400 4,438,840 1878.9 0.0517 97.1 163,100 3,042,648 5360.5 0.0243 130.3 168,100 1,122,105 0.0064 95.1 14980.8 465.3 Once we have calculated age-specific mortality rates for all age groups, we must assign each rate a weight according to the proportion of people in that age group in the reference population. In this example, we use the reference population structure issued by the WHO. The numbers in column D indicate the proportion of the world population that falls within each age cohort. Our task is to weight each cohort from the England and Wales according to the reference population. For example, since the 5-14 years group is 0.1729 of the total reference population, the England and Wales age-specific mortality rate for this age group should also constitute that fraction of the total age-adjusted figure for the England and Wales population. To achieve this, we multiply each age-specific rate (C) by the fraction of the reference population represented by that age group (D) to obtain the weighted rate (E). Finally, we add all the weighted rates from column E to determine the age-adjusted rate (465 per 100,000). This age-adjusted rate can then fairly be compared with the age-adjusted rates of other populations with different demographic structures, as long as they have been calculated with the same reference population. Anthamatten and Hazen (2011), An Introduction to the Geography of Health Exercise 1. Using these techniques, calculate the direct age-adjusted mortality rate for the US in 2006 using the same reference population as above. (The crude mortality rate for the US population is 810 per 100,000). 0-4 5-14 15-24 25-34 35-44 45-54 55-64 65-74 75-84 85+ United States, 2006 (A) (C) Number of (B) Rate / Deaths Population 100,000 33,158 20,436,496 6,149 40,453,947 34,887 42,441,606 42,952 40,406,397 83,043 43,660,883 185,031 43,282,105 281,401 31,586,149 390,039 18,914,650 667,338 13,046,868 701,992 5,296,814 (D) (E) Reference Weighted Pop. Rate 0.0886 0.1729 0.1669 0.1554 0.1374 0.1141 0.0827 0.0517 0.0243 0.0064 2. Compare the resulting age-adjusted mortality rates for the US with those from England and Wales that we calculated above. Which country has the lower age-adjusted mortality rate? What does this mean? What hypotheses can you develop that might help explain this difference? Sources Ahmad, O. B., Boschi-Pinto, C., Lopez, A. D., Murray, C. J. L., Lozano, R. and Inoue, M. (2001) Age Standardization of Rates: A new WHO Standard, Geneva: WHO. Hoyert, D. L. and Anderson, R. N. (2001) "Age-adjusted Death Rates: Trend Data Based on the Year 2000 Standard Population", National Vital Statistics Reports, 49: 1-7. Anthamatten and Hazen (2011), An Introduction to the Geography of Health

