Freedom and democracy values in Moldova
advertisement
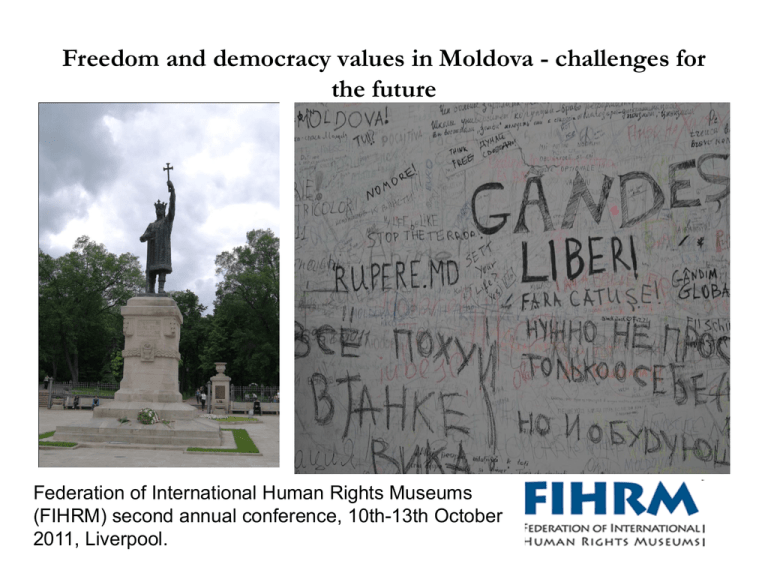
Freedom and democracy values in Moldova - challenges for the future Federation of International Human Rights Museums (FIHRM) second annual conference, 10th-13th October 2011, Liverpool. Slaves...Who? Why? Talking about slavery in Eastern Europe means a lot. It’s not a popular topic. Many people are ignoring this subject, many are afraid to talk. What does it mean? Does it really exist? Let’s clarify the terms: to be a slave means to be a property of the master, to be at his discretion. Few years ago a promotion clip for elections in Romania was banned. http://www.youtube.com/watch?v=lUrBxSMGdEE&feature=related That promo was not good because the word master was used. Choose your masters carefully… In Eastern Europe is hard to talk about modern terms of slavery, of universal right for freedom, but it’s extremely necessary to do it. I will try to explain in figures and numbers what does it mean to be a Romanian from Moldova and why so many illegal emigrants from Moldova are working in West-European countries. Who we are? Republic of Moldova was formed as an Independent State in 1991 after the Declaration of Independence from the Soviet Union. After the elections from 2001,the country became the first post-Soviet state where a nonreformed Communist Party returned to power . The early 2000s was recorded considerable growth of emigration of Moldovans looking for work (mostly illegally) in Russia (especially the Moscow region), Italy, Portugal, Spain, Greece, Cyprus, Turkey, and other countries; transfer of funds from Moldovans abroad account for almost 38% of Moldova's , the second-highest percentage in the world. Unofficially, Moldovan economy is maintained with the money coming from abroad. 75.8% Moldovans 8.3% Ukrainians, 5.9% Russians, 4.4% Gagauzes, 1.9% Bulgarians, 3.7% others Moldova In 2011 population of Moldova estimate 3,560,400 people History in data: • In 1812 part of Moldova named Bessarabia was ceded to Russian Empire. As part of this process, the Tsarist administration in Bessarabia gradually removed the Romanian language from official and religious use, Romanian books were burned and forbidden. • Following the Russian Revolution1917 a Bessarabia parliament, Sfatul Tarii, was elected and in 1918 on March 27 proclaimed Re-Unification with Romanian Kingdom. • This union was recognized by the principal Allied Powers in the 1920, Treaty of Paris, which however was not ratified by all of its signatories, some major powers, such as the United States and the communist Russia, did not recognize Romanian rule over Bessarabia, the latter considering it an occupation of Russian territory. Moldova • • After Second World War Bessarabia was left to Soviet Union. During the Stalinist period (1940–1941, 1944–1953), deportation to the northern Urals, to Siberia, and northern Kazakhstan occurred regularly, with the largest ones on 12–13 June 1941, and 5–6 July 1949, accounting from MSSR alone for 18,392 and 35,796 deportees respectively. Other forms of Soviet persecution of the population included 32,433 political arrests, followed by Gulag or (in 8,360 cases) execution. The deported were characterized as "counter-revolutionaries and nationalists”, dangerous elements of soviet society. The truth is that all Romanian intellectuals , teachers, priests, former state employees of Romanian Authorities were arrested and deported. On June 12–13, 1941, 29,839 people were deported On July 6, 1949, 35,796 people were arrested and deported All deported people were replaced by population from Russia. • cultural identity of Romanian population from Moldova was destroyed • Romanian Orthodox Church Closed • Romanian books burned in central square of Chisinau. • Romanian language was transferred to Cyrillic alphabet • A new “history” and “culture” was invented • Lands and properties confiscated • Those that did not accepted new rules were deported or executed Why running from Moldova? Labor migration • • • • • • • Italy 16.3 % Russia 61.9 % Turkey 2.1 % Portugal 4.5 % Greece 2.5 % Ukraine 2.2% Other countries 10.5 % Unemployment in Moldova • • • • • 1999 - 57,800 2000 - 50,800 2001 - 59,500 2002 - 63,300 2003 - 62,300 http://www.statistica.md/statistics/dat/697/e n/Somaj_1995_2003_en.htm FACES BEFORE AND AFTER FACES BEFORE AND AFTER FACES BEFORE AND AFTER FACES BEFORE AND AFTER Epilogue
