CBS CORP. ‘B’ NYSE-CBS
TIMELINESS
SAFETY
TECHNICAL
2
3
2
RECENT
PRICE
High:
Low:
Raised 4/8/16
32.0
23.8
35.8
25.6
27.2
4.4
17.5 RELATIVE
DIV’D
Median: 15.0) P/E RATIO 0.70 YLD 1.3%
54.44 P/ERATIO 13.4(Trailing:
14.6
3.1
19.7
12.3
29.7
18.0
38.3
27.2
64.1
37.4
68.1
48.8
63.9
38.5
58.2
41.4
Target Price Range
2019 2020 2021
LEGENDS
10.0 x ″Cash Flow″ p sh
. . . . Relative Price Strength
Options: Yes
Shaded area indicates recession
New 5/19/06
Lowered 7/22/16
BETA 1.20 (1.00 = Market)
VALUE
LINE
120
100
80
64
48
2019-21 PROJECTIONS
Ann’l Total
Price
Gain
Return
High
90 (+65%) 15%
Low
60 (+10%)
4%
Insider Decisions
to Buy
Options
to Sell
S
0
0
0
O
0
0
0
N
0
0
0
D
0
0
0
J F
0 0
2 20
0 1
M
0
1
1
A
0
2
1
32
24
20
16
12
M
0
2
3
% TOT. RETURN 6/16
Institutional Decisions
3Q2015
4Q2015
1Q2016
290
316
283
to Buy
to Sell
351
337
334
Hld’s(000) 372796 363679 358037
Percent
shares
traded
45
30
15
1 yr.
3 yr.
5 yr.
THIS
STOCK
VL ARITH.*
INDEX
-0.7
14.9
102.2
-1.9
26.6
54.4
8
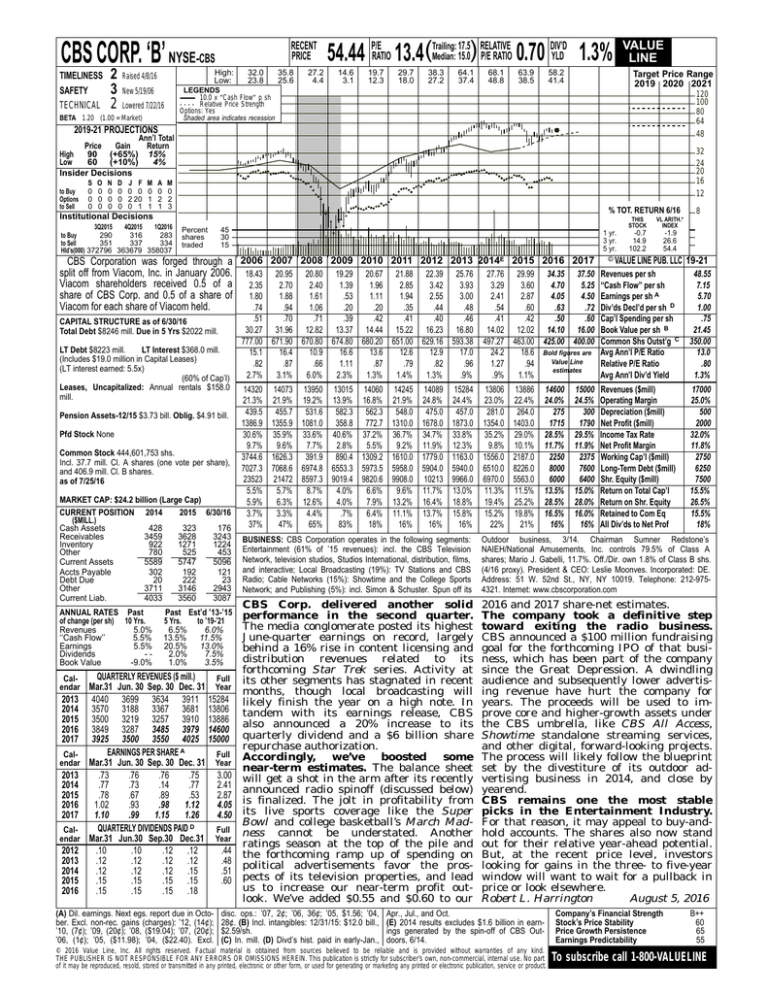
CBS Corporation was forged through a 2006 2007 2008 2009 2010 2011 2012 2013 2014E 2015 2016 2017 © VALUE LINE PUB. LLC 19-21
split off from Viacom, Inc. in January 2006. 18.43 20.95 20.80 19.29 20.67 21.88 22.39 25.76 27.76 29.99 34.35 37.50 Revenues per sh
48.55
Viacom shareholders received 0.5 of a 2.35 2.70 2.40 1.39 1.96 2.85 3.42 3.93
3.29
3.60
4.70
5.25 ‘‘Cash Flow’’ per sh
7.15
share of CBS Corp. and 0.5 of a share of 1.80 1.88 1.61
.53
1.11
1.94
2.55
3.00
2.41
2.87
4.05
4.50 Earnings per sh A
5.70
Viacom for each share of Viacom held.
.74
.94
1.06
.20
.20
.35
.44
.48
1.00
.54
.60
.63
.72 Div’ds Decl’d per sh D
CAPITAL STRUCTURE as of 6/30/16
Total Debt $8246 mill. Due in 5 Yrs $2022 mill.
LT Debt $8223 mill.
LT Interest $368.0 mill.
(Includes $19.0 million in Capital Leases)
(LT interest earned: 5.5x)
(60% of Cap’l)
Leases, Uncapitalized: Annual rentals $158.0
mill.
Pension Assets-12/15 $3.73 bill. Oblig. $4.91 bill.
Pfd Stock None
Common Stock 444,601,753 shs.
Incl. 37.7 mill. Cl. A shares (one vote per share),
and 406.9 mill. Cl. B shares.
as of 7/25/16
MARKET CAP: $24.2 billion (Large Cap)
CURRENT POSITION 2014
2015 6/30/16
($MILL.)
Cash Assets
428
323
176
Receivables
3459
3628
3243
Inventory
922
1271
1224
Other
780
525
453
Current Assets
5589
5747
5096
Accts Payable
302
192
121
Debt Due
20
222
23
Other
3711
3146
2943
Current Liab.
4033
3560
3087
ANNUAL RATES Past
of change (per sh) 10 Yrs.
Revenues
5.0%
‘‘Cash Flow’’
5.5%
Earnings
5.5%
Dividends
-Book Value
-9.0%
Past Est’d ’13-’15
5 Yrs.
to ’19-’21
6.5%
6.0%
13.5% 11.5%
20.5% 13.0%
2.0%
7.5%
1.0%
3.5%
QUARTERLY REVENUES ($ mill.)
Full
Mar.31 Jun. 30 Sep. 30 Dec. 31 Year
2013 4040 3699 3634 3911 15284
2014 3570 3188 3367 3681 13806
2015 3500 3219 3257 3910 13886
2016 3849 3287 3485 3979 14600
2017 3925 3500 3550 4025 15000
EARNINGS PER SHARE A
CalFull
endar Mar.31 Jun. 30 Sep. 30 Dec. 31 Year
2013
.73
.76
.76
.75
3.00
2014
.77
.73
.14
.77
2.41
2015
.78
.67
.89
.53
2.87
2016
1.02
.93
.98
1.12
4.05
2017
1.10
.99
1.15
1.26
4.50
QUARTERLY DIVIDENDS PAID D
CalFull
endar Mar.31 Jun.30 Sep.30 Dec.31 Year
2012
.10
.10
.12 .12
.44
2013
.12
.12
.12 .12
.48
2014
.12
.12
.12 .15
.51
2015
.15
.15
.15 .15
.60
2016
.15
.15
.15 .18
Calendar
(A) Dil. earnings. Next egs. report due in October. Excl. non-rec. gains (charges): ’12, (14¢);
’10, (7¢); ’09, (20¢); ’08, ($19.04); ’07, (20¢);
’06, (1¢); ’05, ($11.98); ’04, ($22.40). Excl.
.51
.70
.71
.39
.42
.41
.40
.46
30.27 31.96 12.82 13.37 14.44 15.22 16.23 16.80
777.00 671.90 670.80 674.80 680.20 651.00 629.16 593.38
15.1
16.4
10.9
16.6
13.6
12.6
12.9
17.0
.82
.87
.66
1.11
.87
.79
.82
.96
2.7%
3.1%
6.0%
2.3%
1.3%
1.4%
1.3%
.9%
.41
.42
.50
.60
14.02 12.02 14.10 16.00
497.27 463.00 425.00 400.00
24.2
18.6 Bold figures are
Value Line
1.27
.94
estimates
.9%
1.1%
Cap’l Spending per sh
Book Value per sh B
Common Shs Outst’g C
Avg Ann’l P/E Ratio
Relative P/E Ratio
Avg Ann’l Div’d Yield
.75
21.45
350.00
13.0
.80
1.3%
14320 14073 13950 13015 14060 14245 14089 15284
21.3% 21.9% 19.2% 13.9% 16.8% 21.9% 24.8% 24.4%
439.5 455.7 531.6 582.3 562.3 548.0 475.0 457.0
1386.9 1355.9 1081.0 358.8 772.7 1310.0 1678.0 1873.0
30.6% 35.9% 33.6% 40.6% 37.2% 36.7% 34.7% 33.8%
9.7%
9.6%
7.7%
2.8%
5.5%
9.2% 11.9% 12.3%
3744.6 1626.3 391.9 890.4 1309.2 1610.0 1779.0 1163.0
7027.3 7068.6 6974.8 6553.3 5973.5 5958.0 5904.0 5940.0
23523 21472 8597.3 9019.4 9820.6 9908.0 10213 9966.0
5.5%
5.7%
8.7%
4.0%
6.6%
9.6% 11.7% 13.0%
5.9%
6.3% 12.6%
4.0%
7.9% 13.2% 16.4% 18.8%
3.7%
3.3%
4.4%
.7%
6.4% 11.1% 13.7% 15.8%
37%
47%
65%
83%
18%
16%
16%
16%
13806
23.0%
281.0
1354.0
35.2%
9.8%
1556.0
6510.0
6970.0
11.3%
19.4%
15.2%
22%
Revenues ($mill)
Operating Margin
Depreciation ($mill)
Net Profit ($mill)
Income Tax Rate
Net Profit Margin
Working Cap’l ($mill)
Long-Term Debt ($mill)
Shr. Equity ($mill)
Return on Total Cap’l
Return on Shr. Equity
Retained to Com Eq
All Div’ds to Net Prof
17000
25.0%
500
2000
32.0%
11.8%
2750
6250
7500
15.5%
26.5%
15.5%
18%
BUSINESS: CBS Corporation operates in the following segments:
Entertainment (61% of ’15 revenues): incl. the CBS Television
Network, television studios, Studios International, distribution, films,
and interactive; Local Broadcasting (19%): TV Stations and CBS
Radio; Cable Networks (15%): Showtime and the College Sports
Network; and Publishing (5%): incl. Simon & Schuster. Spun off its
Outdoor business, 3/14. Chairman Sumner Redstone’s
NAIEH/National Amusements, Inc. controls 79.5% of Class A
shares; Mario J. Gabelli, 11.7%. Off./Dir. own 1.8% of Class B shs.
(4/16 proxy). President & CEO: Leslie Moonves. Incorporated: DE.
Address: 51 W. 52nd St., NY, NY 10019. Telephone: 212-9754321. Internet: www.cbscorporation.com
CBS Corp. delivered another solid
performance in the second quarter.
The media conglomerate posted its highest
June-quarter earnings on record, largely
behind a 16% rise in content licensing and
distribution revenues related to its
forthcoming Star Trek series. Activity at
its other segments has stagnated in recent
months, though local broadcasting will
likely finish the year on a high note. In
tandem with its earnings release, CBS
also announced a 20% increase to its
quarterly dividend and a $6 billion share
repurchase authorization.
Accordingly,
we’ve
boosted
some
near-term estimates. The balance sheet
will get a shot in the arm after its recently
announced radio spinoff (discussed below)
is finalized. The jolt in profitability from
its live sports coverage like the Super
Bowl and college basketball’s March Madness cannot be understated. Another
ratings season at the top of the pile and
the forthcoming ramp up of spending on
political advertisements favor the prospects of its television properties, and lead
us to increase our near-term profit outlook. We’ve added $0.55 and $0.60 to our
2016 and 2017 share-net estimates.
The company took a definitive step
toward exiting the radio business.
CBS announced a $100 million fundraising
goal for the forthcoming IPO of that business, which has been part of the company
since the Great Depression. A dwindling
audience and subsequently lower advertising revenue have hurt the company for
years. The proceeds will be used to improve core and higher-growth assets under
the CBS umbrella, like CBS All Access,
Showtime standalone streaming services,
and other digital, forward-looking projects.
The process will likely follow the blueprint
set by the divestiture of its outdoor advertising business in 2014, and close by
yearend.
CBS remains one the most stable
picks in the Entertainment Industry.
For that reason, it may appeal to buy-andhold accounts. The shares also now stand
out for their relative year-ahead potential.
But, at the recent price level, investors
looking for gains in the three- to five-year
window will want to wait for a pullback in
price or look elsewhere.
Robert L. Harrington
August 5, 2016
disc. ops.: ’07, 2¢; ’06, 36¢; ’05, $1.56; ’04,
28¢. (B) Incl. intangibles: 12/31/15: $12.0 bill.,
$2.59/sh.
(C) In. mill. (D) Divd’s hist. paid in early-Jan.,
13886
22.4%
264.0
1403.0
29.0%
10.1%
2187.0
8226.0
5563.0
11.5%
25.2%
19.8%
21%
14600
24.0%
275
1715
28.5%
11.7%
2250
8000
6000
13.5%
28.5%
16.5%
16%
Apr., Jul., and Oct.
(E) 2014 results excludes $1.6 billion in earnings generated by the spin-off of CBS Outdoors, 6/14.
© 2016 Value Line, Inc. All rights reserved. Factual material is obtained from sources believed to be reliable and is provided without warranties of any kind.
THE PUBLISHER IS NOT RESPONSIBLE FOR ANY ERRORS OR OMISSIONS HEREIN. This publication is strictly for subscriber’s own, non-commercial, internal use. No part
of it may be reproduced, resold, stored or transmitted in any printed, electronic or other form, or used for generating or marketing any printed or electronic publication, service or product.
15000
24.5%
300
1790
29.5%
11.9%
2375
7600
6400
15.0%
28.0%
16.0%
16%
Company’s Financial Strength
Stock’s Price Stability
Price Growth Persistence
Earnings Predictability
B++
60
65
55
To subscribe call 1-800-VALUELINE


