LULULEMON NDQ-LULU
TIMELINESS
SAFETY
TECHNICAL
2
3
3
RECENT
PRICE
High:
Low:
Raised 7/29/16
30.3
12.5
24.2
3.4
42.0 RELATIVE
DIV’D
Median: NMF) P/E RATIO 1.90 YLD
77.30 P/ERATIO 36.0(Trailing:
15.6
2.2
37.3
12.9
LEGENDS
24.0 x ″Cash Flow″ p sh
. . . . Relative Price Strength
2-for-1 split 7/11
Options: Yes
Shaded area indicates recession
New 2/5/10
Lowered 6/24/16
BETA 1.05 (1.00 = Market)
2019-21 PROJECTIONS
64.5
32.7
81.1
46.9
82.5
57.3
59.8
36.3
70.0
43.1
Nil
78.4
52.7
VALUE
LINE
Target Price Range
2019 2020 2021
160
120
100
80
60
50
40
30
2-for-1
Ann’l Total
Price
Gain
Return
High 130 (+70%) 14%
Low
85 (+10%)
3%
Insider Decisions
to Buy
Options
to Sell
S
1
1
0
O
0
1
0
N
0
0
0
D
0
0
0
J
0
0
0
F
0
1
0
M
0
0
0
A
0
6
1
M
0
0
0
% TOT. RETURN 6/16
Institutional Decisions
3Q2015
4Q2015
1Q2016
177
164
191
to Buy
to Sell
146
174
169
Hld’s(000) 138423 136901 129656
Percent
shares
traded
75
50
25
1 yr.
3 yr.
5 yr.
THIS
STOCK
VL ARITH.*
INDEX
13.1
12.8
32.1
-1.9
26.6
54.4
20
15
lululemon athletica inc. was founded by 2006 2007 2008 2009 2010 2011 2012 2013 2014 2015 2016 2017 © VALUE LINE PUB. LLC 19-21
Dennis ‘‘Chip’’ Wilson in 1998 to fill a void in
-2.03
2.53
3.21
5.00
6.97
9.49 10.95 12.66 15.01 17.25 19.25 Sales per sh A
29.65
the women’s athletic apparel market. The
-.29
.42
.56
.97
1.48
2.17
2.26
2.33
2.44
2.80
3.25 ‘‘Cash Flow’’per sh
5.30
company’s first store opened in November
-.23
.31
.41
.79
1.26
1.85
1.91
1.89
1.86
2.15
2.55 Earnings per sh A B
4.25
of 2000 in Vancouver, British Columbia to
----------Nil
Nil Div’ds Decl’d per sh
Nil
sell clothing made of technical fabrics, pri-.83
1.11
1.65
2.74
4.19
6.14
7.55
7.68
7.48
9.35 11.00 Book Value per sh
16.30
marily for yoga. The company went public in
- - 135.24 139.88 141.02 142.39 143.55 144.44 145.30 141.95 137.29 136.00 136.00 Common Shs Outst’g C 135.00
July of 2007.
-87.7
35.8
22.1
28.1
39.9
37.3
35.6
25.0
24.4
32.2 Bold figures are Avg Ann’l P/E Ratio
CAPITAL STRUCTURE as of 5/1/16
Total Debt None
Leases, Uncapitalized: Annual rentals $107.5 mill.
No Defined Benefit Pension Plan
Common Stock 136,977,974
as of 6/3/16
MARKET CAP: $10.6 billion (Large Cap)
CURRENT POSITION
($MILL.)
Cash Assets
Receivables
Inventory (Avg Cst)
Other
Current Assets
Accts Payable
Debt Due
Other
Current Liab.
2014
2015
5/1/16
664.5
13.7
208.1
64.7
951.0
9.3
-150.6
159.9
501.5
13.1
284.0
118.4
917.0
10.4
-215.1
225.5
550.0
9.5
286.2
125.5
971.2
6.4
-196.0
202.4
ANNUAL RATES Past
of change (per sh) 10 Yrs.
Sales
-‘‘Cash Flow’’
-Earnings
-Dividends
-Book Value
-Fiscal
Year
Begins
2013
2014
2015
2016
2017
Fiscal
Year
Begins
2013
2014
2015
2016
2017
Calendar
2012
2013
2014
2015
2016
Past Est’d ’13-’15
5 Yrs.
to ’19-’21
29.0% 15.0%
29.5% 14.5%
30.5% 14.5%
-Nil
33.0% 13.5%
Full
QUARTERLY SALES ($ mill.) A
Fiscal
Apr.Per Jul.Per Oct.Per Jan.Per Year
345.8 344.5 379.9 521.0 1591.2
384.6 390.7 419.4 602.5 1797.2
423.5 453.0 479.7 704.3 2060.5
495.5 515
543
791.5 2345
550
575
605
885
2615
Full
EARNINGS PER SHARE A B
Fiscal
Apr.Per Jul.Per Oct.Per Jan.Per Year
.32
.39
.45
.75
1.91
.34
.33
.42
.78
1.89
.34
.34
.35
.85
1.86
.30
.38
.46
1.01
2.15
.42
.48
.50
1.15
2.55
QUARTERLY DIVIDENDS PAID
Full
Mar.31 Jun.30 Sep.30 Dec.31 Year
NO CASH DIVIDENDS
BEING PAID
(A) Fiscal year ends Sunday closest to January
31st of the following calendar year.
(B) Diluted earnings. Results prior to 7/07 IPO
are pro forma. Earnings may not sum due to
---
4.66
--
2.15
--
1.47
--
148.9
54.1%
18.8%
51
12.4
47.9%
8.3%
17.2
-37.4
33.1%
33.1%
33.1%
--
274.7
56.3%
21.3%
81
30.8
40.2%
11.2%
62.1
-112.0
27.9%
27.5%
27.5%
--
353.5
53.6%
21.7%
113
43.4
29.8%
12.3%
71.7
-154.8
28.0%
28.0%
28.0%
--
452.9
52.3%
23.8%
124
58.3
32.8%
12.9%
157.7
-233.1
25.0%
25.0%
25.0%
--
1.79
--
2.50
--
2.37
--
2.00
--
711.7 1000.8 1370.4 1591.2
57.8% 59.0% 57.9% 55.1%
29.1% 31.7% 30.6% 27.7%
137
174
211
254
112.9 182.4 270.6 279.5
38.2% 36.1% 28.8% 29.6%
15.9% 18.2% 19.7% 17.6%
303.9 423.7 653.7 829.3
----390.4 601.4 887.3 1096.7
28.9% 30.3% 30.5% 25.5%
28.9% 30.3% 30.5% 25.5%
28.9% 30.3% 30.5% 25.5%
-----
1.28
--
Value Line
estimates
1.63
--
1797.2 2060.5
53.9% 51.9%
24.2% 21.5%
302
363
272.7 261.9
28.8% 29.5%
15.2% 12.7%
791.1 691.5
--1089.6 1027.5
25.0% 25.5%
25.0% 25.5%
25.0% 25.5%
---
2345
52.5%
22.0%
407
296
30.2%
12.6%
700
Nil
1275
23.0%
23.0%
23.0%
Nil
2615
53.0%
22.5%
445
350
30.0%
13.4%
700
Nil
1500
23.5%
23.5%
23.5%
Nil
Relative P/E Ratio
Avg Ann’l Div’d Yield
Sales ($mill)
Gross Margin
Operating Margin
Number of Stores
Net Profit ($mill)
Income Tax Rate
Net Profit Margin
Working Cap’l ($mill)
Long-Term Debt ($mill)
Shr. Equity ($mill)
Return on Total Cap’l
Return on Shr. Equity
Retained to Com Eq
All Div’ds to Net Prof
1.55
Nil
4000
54.0%
24.5%
600
580
30.0%
14.5%
900
Nil
2200
26.5%
26.5%
26.5%
Nil
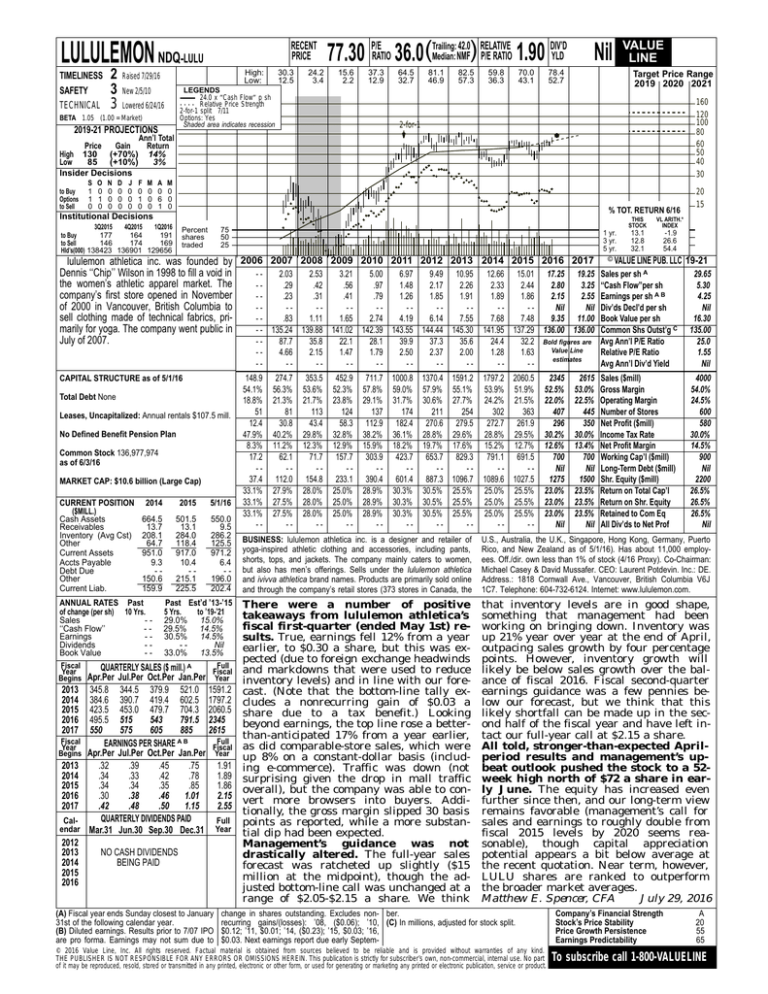
BUSINESS: lululemon athletica inc. is a designer and retailer of
yoga-inspired athletic clothing and accessories, including pants,
shorts, tops, and jackets. The company mainly caters to women,
but also has men’s offerings. Sells under the lululemon athletica
and ivivva athletica brand names. Products are primarily sold online
and through the company’s retail stores (373 stores in Canada, the
U.S., Australia, the U.K., Singapore, Hong Kong, Germany, Puerto
Rico, and New Zealand as of 5/1/16). Has about 11,000 employees. Off./dir. own less than 1% of stock (4/16 Proxy). Co-Chairman:
Michael Casey & David Mussafer. CEO: Laurent Potdevin. Inc.: DE.
Address.: 1818 Cornwall Ave., Vancouver, British Columbia V6J
1C7. Telephone: 604-732-6124. Internet: www.lululemon.com.
There were a number of positive
takeaways from lululemon athletica’s
fiscal first-quarter (ended May 1st) results. True, earnings fell 12% from a year
earlier, to $0.30 a share, but this was expected (due to foreign exchange headwinds
and markdowns that were used to reduce
inventory levels) and in line with our forecast. (Note that the bottom-line tally excludes a nonrecurring gain of $0.03 a
share due to a tax benefit.) Looking
beyond earnings, the top line rose a betterthan-anticipated 17% from a year earlier,
as did comparable-store sales, which were
up 8% on a constant-dollar basis (including e-commerce). Traffic was down (not
surprising given the drop in mall traffic
overall), but the company was able to convert more browsers into buyers. Additionally, the gross margin slipped 30 basis
points as reported, while a more substantial dip had been expected.
Management’s guidance was not
drastically altered. The full-year sales
forecast was ratcheted up slightly ($15
million at the midpoint), though the adjusted bottom-line call was unchanged at a
range of $2.05-$2.15 a share. We think
that inventory levels are in good shape,
something that management had been
working on bringing down. Inventory was
up 21% year over year at the end of April,
outpacing sales growth by four percentage
points. However, inventory growth will
likely be below sales growth over the balance of fiscal 2016. Fiscal second-quarter
earnings guidance was a few pennies below our forecast, but we think that this
likely shortfall can be made up in the second half of the fiscal year and have left intact our full-year call at $2.15 a share.
All told, stronger-than-expected Aprilperiod results and management’s upbeat outlook pushed the stock to a 52week high north of $72 a share in early June. The equity has increased even
further since then, and our long-term view
remains favorable (management’s call for
sales and earnings to roughly double from
fiscal 2015 levels by 2020 seems reasonable), though capital appreciation
potential appears a bit below average at
the recent quotation. Near term, however,
LULU shares are ranked to outperform
the broader market averages.
Matthew E. Spencer, CFA
July 29, 2016
change in shares outstanding. Excludes non- ber.
recurring gains/(losses): ’08, ($0.06); ’10, (C) In millions, adjusted for stock split.
$0.12; ’11, $0.01; ’14, ($0.23); ’15, $0.03; ’16,
$0.03. Next earnings report due early Septem-
© 2016 Value Line, Inc. All rights reserved. Factual material is obtained from sources believed to be reliable and is provided without warranties of any kind.
THE PUBLISHER IS NOT RESPONSIBLE FOR ANY ERRORS OR OMISSIONS HEREIN. This publication is strictly for subscriber’s own, non-commercial, internal use. No part
of it may be reproduced, resold, stored or transmitted in any printed, electronic or other form, or used for generating or marketing any printed or electronic publication, service or product.
Company’s Financial Strength
Stock’s Price Stability
Price Growth Persistence
Earnings Predictability
A
20
55
65
To subscribe call 1-800-VALUELINE


