Document 16055607
advertisement
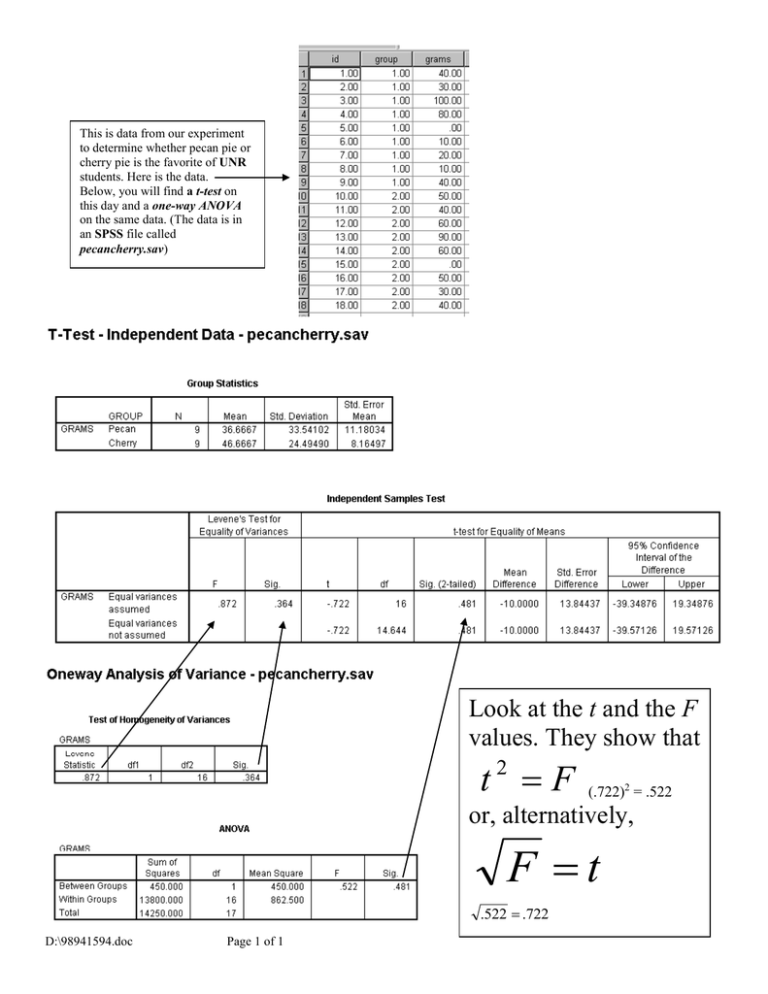
This is data from our experiment to determine whether pecan pie or cherry pie is the favorite of UNR students. Here is the data. Below, you will find a t-test on this day and a one-way ANOVA on the same data. (The data is in an SPSS file called pecancherry.sav) Look at the t and the F values. They show that t2 F (.722)2 = .522 or, alternatively, F t .522 .722 D:\98941594.doc Page 1 of 1


![AGR 3204 Worksheet III 2023[1]](http://s2.studylib.net/store/data/026147200_1-a188d926b2945548ad81004a9af314c7-300x300.png)
