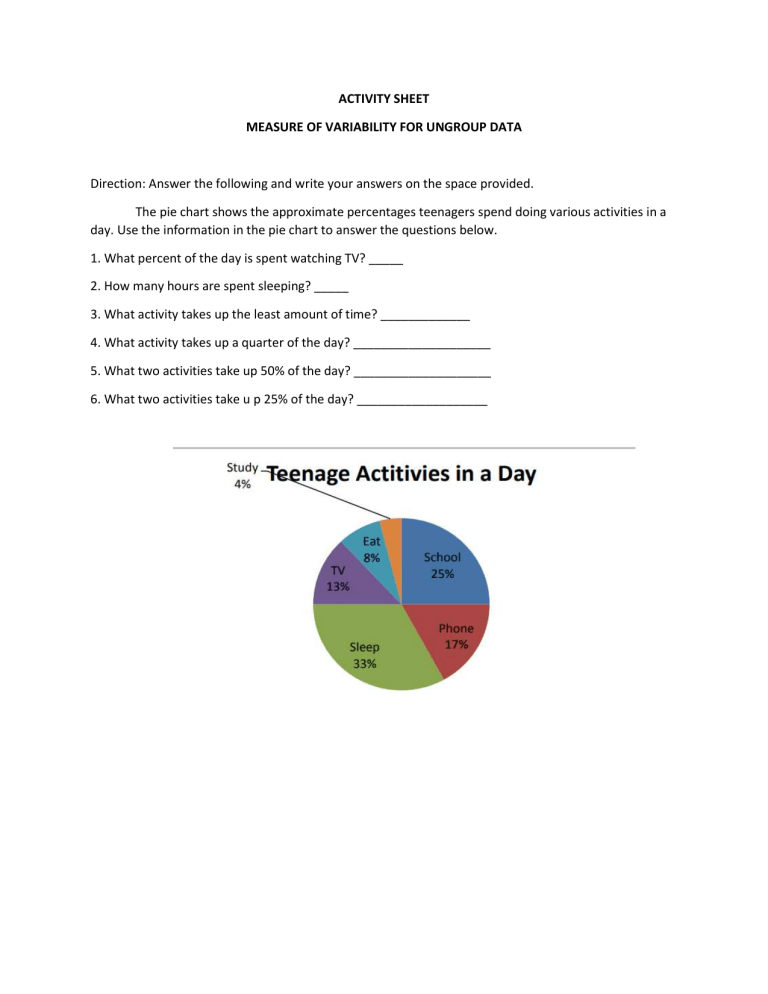
ACTIVITY SHEET MEASURE OF VARIABILITY FOR UNGROUP DATA Direction: Answer the following and write your answers on the space provided. The pie chart shows the approximate percentages teenagers spend doing various activities in a day. Use the information in the pie chart to answer the questions below. 1. What percent of the day is spent watching TV? _____ 2. How many hours are spent sleeping? _____ 3. What activity takes up the least amount of time? _____________ 4. What activity takes up a quarter of the day? ____________________ 5. What two activities take up 50% of the day? ____________________ 6. What two activities take u p 25% of the day? ___________________

