Unit 4 - EOCT Review Form 401
advertisement
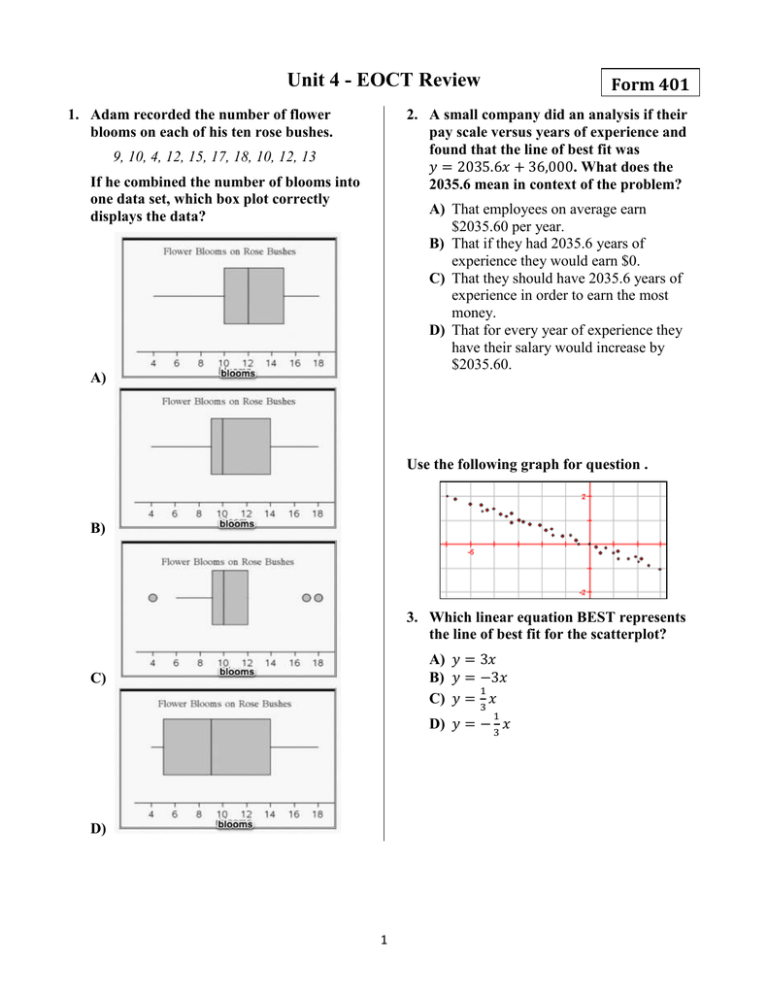
Unit 4 - EOCT Review 1. Adam recorded the number of flower blooms on each of his ten rose bushes. Form 401 2. A small company did an analysis if their pay scale versus years of experience and found that the line of best fit was 𝑦 = 2035.6𝑥 + 36,000. What does the 2035.6 mean in context of the problem? 9, 10, 4, 12, 15, 17, 18, 10, 12, 13 If he combined the number of blooms into one data set, which box plot correctly displays the data? A) That employees on average earn $2035.60 per year. B) That if they had 2035.6 years of experience they would earn $0. C) That they should have 2035.6 years of experience in order to earn the most money. D) That for every year of experience they have their salary would increase by $2035.60. A) Use the following graph for question . B) 3. Which linear equation BEST represents the line of best fit for the scatterplot? A) 𝑦 = 3𝑥 B) 𝑦 = −3𝑥 1 C) 𝑦 = 3 𝑥 C) 1 D) 𝑦 = − 𝑥 3 D) 1 4. Victor, Vladimir, Venus, and Vivian each have a different set of data points. Each used the linear regression feature of his/her graphing calculator to find a linear function that models his/her data. Use the following table for question . The value of the correlation coefficient (r) associated with Victor’s function was –0.91, the value or r for Vladimir’s function was 0.73, the value of r for Venus’s function was –0.44, and the value of r for Vivian’s function was 0.88. Who has the BEST model for his or her data? A) B) C) D) Venus Victor Vivian Vladimir Does Not Drink Soda Play Video Games 13 7 Does Not Play Video Games 6 4 Mr. Jones Hours Worked Hours Worked 10 8 15 20 17 11 18 15 12 33 30 18 14 22 8 23 5 27 16 25 6. Mrs. Cox and Mr. Jones are in charge of the work-study program for Oak High School. Each teacher is in charge of supervising 10 students. They are comparing statistics for the two groups of students based on the hours worked per week. Which statement is true? Use the following table for question . Drink Soda Mrs. Cox A) The mean for Mrs. Cox is greater than the mean for Mr. Jones. B) The median for Mrs. Cox is greater than the median for Mr. Jones. C) The Interquartile Range for Mrs. Cox is less than the Interquartile Range for Mr. Jones. D) The Interquartile Range for Mrs. Cox is greater than the Interquartile Range for Mr. Jones. 5. Jordan interviewed her 30 classmates on whether or not they played video games and if they drink soda. She displayed her results in the two-way table shown. Which statement is true? A) About 67% of her classmates play video games. B) More than half of her classmates drink soda and play video games. C) There is a greater percentage of students who don't play video games then those who don't drink soda. D) The same percentage of students who don't play video games and don't drink soda as those who don't play video games and drink soda. 2 Use the following table for question . Blood Type Male Female A 105 93 B 99 O AB Use the following table for question . 2005 2006 2007 2008 Plant 1 20 4 25 10 84 Plant 2 25 5 5 48 160 140 Plant 3 20 8 20 32 15 18 Plant 4 43 10 10 47 Plant 5 40 11 15 48 7. A local hospital kept track one day of the blood type of their male and female patients. The results are shown in the table. What is the relative frequency of a male patient having blood type AB? A) B) C) D) 9. During which year were the mean and median the same value? A) B) C) D) 0.021 0.025 0.118 0.139 2005 2006 2007 2008 Use the following graph for question . Use the following table for question . Temperature 50 42 31 62 51 55 45 (°F) 8. Which boxplot correctly displays the data in the set? A) 10. The scatterplot for a set of data points is shown, along with the line of best fit. Choose the BEST estimate for r, the correlation coefficient. B) C) A) B) C) D) D) 3 -1.0 -0.8 0.8 1.0 11. Which relationship is likely ONLY a correlation and NOT one of causation? Use the following graphs for question . A) As the temperature increases, the number of air conditioners being used increases. B) As the price of a gallon of gas increases, the number of gallons of gas sold decreases. C) As the number of visitors to a park increases, the number of flowers in bloom at the park increases. D) As the amount of time a student spends studying for a test decreases, the student’s score on the test decreases. Use the following graphs for question . 13. Mike owns two hardware stores. The scatterplots show the number of items sold at a specific price for each store in one week. If he wants to sell a new type of hammer for $30, at which store should Mike sell the hammer? A) Store #2. This store makes more money. B) Store #1. This store makes more money. C) Store #1. Mike sells more $30 items at this store. D) Store #2. Mike sells more $30 items at this store. 12. Which scatterplot(s) show a positive correlation? A) B) C) D) Plot B Plot D Plots A and C Plots A, C and D 4 Use the following graph for question . Use the following graph for question . 14. The scatterplot shown compares the price of gasoline (in dollars) and the number of hybrid cars sold (in thousands) in Georgia. Describe the relationship between price of gasoline and number of hybrid cars sold. 16. Jennifer has the scatterplot shown for her data set, where water is measured in ounces, and is trying to describe the line of best fit. Which choice correctly describes the line of best fit? A) B) C) D) A) As the temperature decreases, her water intake decreases. B) As the temperature increases, her water intake increases. C) As the temperature decreases, her water intake increases. D) There is no relationship between temperature and water intake. There is no correlation. There is a positive correlation. There is a negative correlation. There is a non-linear relationship. Use the following graph for question . Use the following graph for question . 15. A survey was taken asking participants their age and how many soft drinks they drink a week. The results are displayed in the scatterplot. The data for people age 15-19 are not shown. Based on the scatterplot, how many soft drinks would 15-19 year olds be expected to drink in a week? A) B) C) D) 17. Which equation is the BEST fit for the data in the graph? A) 𝑦 = 𝑥 + 2 B) 𝑦 = 2𝑥 + 1 1 C) 𝑦 = 𝑥 − 2 4 6 8 14 1 D) 𝑦 = 2 𝑥 − 1 5 Use the following graph for question . Use the following graph for question . 18. A residual plot for a set of data with a linear regression equation is shown. Which statement is correct? 20. Jess asked five of his friends how long they studied and what grade they earned. Their results are shown in the scatterplot. He then found the line of best fit for the scatterplot to be 𝑦 = 9.6𝑥 + 65.8. Which plot is an accurate residual plot for this data? A) The least squares regression line is a good fit since there is a definite pattern in the residual plot. B) The least squares regression line is not a good fit as there is a definite pattern in the residual plot. C) The least squares regression line is a good fit as you have about the same number of points above and below the line. D) The least squares regression line is not a good fit since there is about the same number of data points above and below the line. A) 19. Managers at a company rate employee's on performance and attitude and find that an employee's attitude depends on their performance. They find a linear relationship and the line of best fit is 𝑦 = 11.7 + 1.02𝑥 What does 1.02 mean in the context of the problem? B) A) That if their attitude rating was 0 the performance rating would be 1.02. B) That if the performance rating was 0, their attitude rating would be 1.02. C) That for every point their performance rating goes up their attitude rating improves by 1.02 points. D) That for every point their attitude rating goes up their performance rating improves by 1.02 points. C) D) 6

