Energy cost saving strategies in distributed power networks / DOI: 10.1051
advertisement
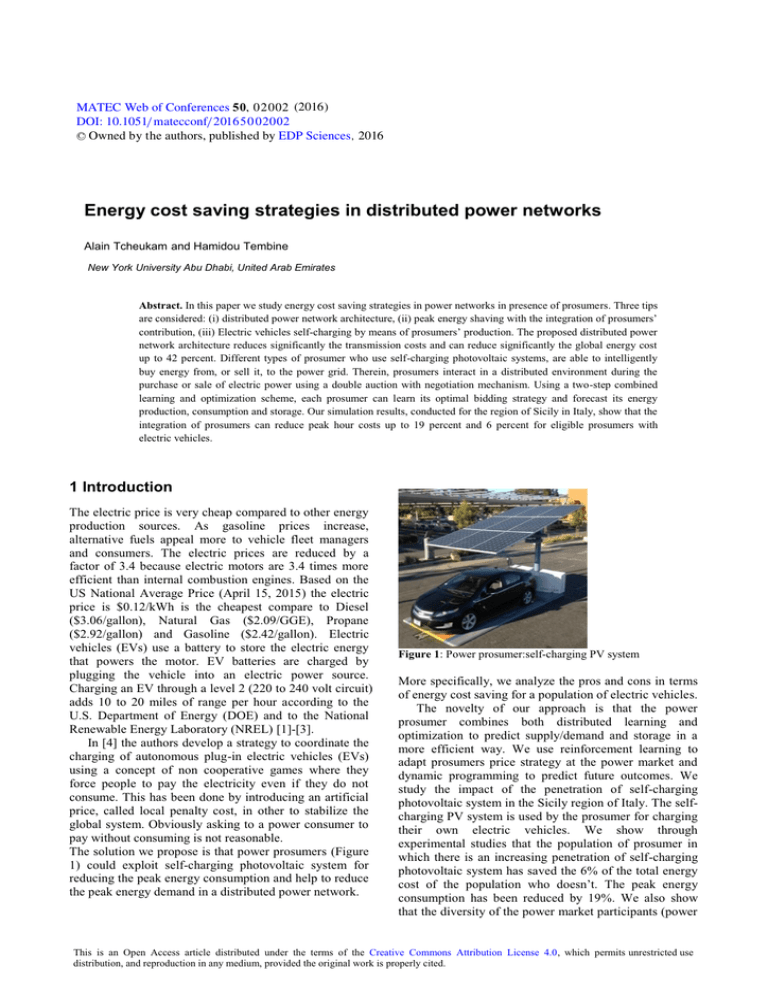
MATEC Web of Conferences 50, 0 2 0 0 2 (2016 ) DOI: 10.1051/ m atecconf/ 2016 5 0 0 2 0 02 C Owned by the authors, published by EDP Sciences, 2016 Energy cost saving strategies in distributed power networks Alain Tcheukam and Hamidou Tembine New York University Abu Dhabi, United Arab Emirates Abstract. In this paper we study energy cost saving strategies in power networks in presence of prosumers. Three tips are considered: (i) distributed power network architecture, (ii) peak energy shaving with the integration of prosumers’ contribution, (iii) Electric vehicles self-charging by means of prosumers’ production. The proposed distributed power network architecture reduces significantly the transmission costs and can reduce significantly the global energy cost up to 42 percent. Different types of prosumer who use self-charging photovoltaic systems, are able to intelligently buy energy from, or sell it, to the power grid. Therein, prosumers interact in a distributed environment during the purchase or sale of electric power using a double auction with negotiation mechanism. Using a two-step combined learning and optimization scheme, each prosumer can learn its optimal bidding strategy and forecast its energy production, consumption and storage. Our simulation results, conducted for the region of Sicily in Italy, show that the integration of prosumers can reduce peak hour costs up to 19 percent and 6 percent for eligible prosumers with electric vehicles. 1 Introduction The electric price is very cheap compared to other energy production sources. As gasoline prices increase, alternative fuels appeal more to vehicle fleet managers and consumers. The electric prices are reduced by a factor of 3.4 because electric motors are 3.4 times more efficient than internal combustion engines. Based on the US National Average Price (April 15, 2015) the electric price is $0.12/kWh is the cheapest compare to Diesel ($3.06/gallon), Natural Gas ($2.09/GGE), Propane ($2.92/gallon) and Gasoline ($2.42/gallon). Electric vehicles (EVs) use a battery to store the electric energy that powers the motor. EV batteries are charged by plugging the vehicle into an electric power source. Charging an EV through a level 2 (220 to 240 volt circuit) adds 10 to 20 miles of range per hour according to the U.S. Department of Energy (DOE) and to the National Renewable Energy Laboratory (NREL) [1]-[3]. In [4] the authors develop a strategy to coordinate the charging of autonomous plug-in electric vehicles (EVs) using a concept of non cooperative games where they force people to pay the electricity even if they do not consume. This has been done by introducing an artificial price, called local penalty cost, in other to stabilize the global system. Obviously asking to a power consumer to pay without consuming is not reasonable. The solution we propose is that power prosumers (Figure 1) could exploit self-charging photovoltaic system for reducing the peak energy consumption and help to reduce the peak energy demand in a distributed power network. Figure 1: Power prosumer:self-charging PV system More specifically, we analyze the pros and cons in terms of energy cost saving for a population of electric vehicles. The novelty of our approach is that the power prosumer combines both distributed learning and optimization to predict supply/demand and storage in a more efficient way. We use reinforcement learning to adapt prosumers price strategy at the power market and dynamic programming to predict future outcomes. We study the impact of the penetration of self-charging photovoltaic system in the Sicily region of Italy. The selfcharging PV system is used by the prosumer for charging their own electric vehicles. We show through experimental studies that the population of prosumer in which there is an increasing penetration of self-charging photovoltaic system has saved the 6% of the total energy cost of the population who doesn’t. The peak energy consumption has been reduced by 19%. We also show that the diversity of the power market participants (power This is an Open Access article distributed under the terms of the Creative Commons Attribution License 4.0, which permits XQUHVWULFWHGXVH distribution, and reproduction in any medium, provided the original work is properly cited. MATEC Web of Conferences consumers, producers and prosumers) allows to shave the peak energy consumption in the power grid. The rest of the paper is organized as follows. In the next Section we describe the DIPONET power architecture and, the learning and optimization methods used by prosumer when buying/selling energy in the power market. In Section 3 we consider the region of Sicily (Italy) for studying the impact of self-charging photovoltaic system. Experimental and numerical results are presented in section 4. Section 5 concludes the paper. The Table 1 summarizes the notations used in the paper. Table1: Notations efficient way to interact in the distributed power network. At the power grid layer, DIPONET consists of a multilevel micro-grids architecture which is sub-divided into 4 levels. The first level (0.4 kV) is a low-range network covering subdivisions (a neighborhood). The second level (10 kV) is a medium-range area network covering a suburb (regional grid). The third level (110 kV) is a longdistance energy transport network. Finally in the fourth level (380 kV) the electricity is produced from large power plants (coal, gas or nuclear). At the power market layer, we consider a multi-stage negotiation system through which the energy produced by micro-grids (at various tiers) are auctioned to/by the prosumers. The balancing of demand and supply between participants is carried out through balancing group managers (BGMs) which are located in different network layers and operate in parallel on each grid. The BGM balances the supply and the demand of electricity between a producer and a consumer who have submitted a similar bid. 2.1 Combined learning and optimization scheme in DIPONET The challenge of the prosumer in DIPONET is to make elastic the demand for, and the supply of, electricity in order to optimize its energy cost based on power market conditions. Prosumer strategies are concerned with two separate phases: negotiation and optimization. We now describe the combined scheme DIPONET by means of learning [7]. 2 DIPONET: a grid of micro-grids The U.S. Energy Information Administration (EIA) estimates that electricity transmission and distribution losses average about 6% of the electricity that is transmitted and distributed annually in the United States. Distributed power network architecture aims to reduce power transmission losses and to integrate renewable energy sources. We focus on the DIPONET power architecture for an efficient power grid management. The idea behind is to manage the grid as a set of micro grids and to reduce power transmission losses from the distribution systems operators to the end-users [5]-6]. Step 1: Reinforcement learning At the end of a negotiation in the power market, the final achieved price by the prosumer, of index n, is normalized according to the frame size of the negotiation. Then, the temporal difference method [3] is used to derive the reward of the negotiation strategy currently executed. Step 2: Optimization The consumer is characterized by the class of energy variation profiles (s)he can adopt during the day. Controllable inputs: we denote by the controllable input of the consumer, n at time t. The consumer has the ability to increase/decrease its energy consumption. State of the consumer n: the state of the consumer is given by the level of the energy reserve where is the average energy consumption (non shiftable energy demand), β is the consumption rate, and is the control action at time t. Objective function: the objective of the consumer is to minimize the electricity cost achieved at the end of the day. Figure 2: DIPONET power architecture. The DIPONET architecture (Figure 2) is more dynamic and the idea is to provide the prosumer a more 02002-p.2 ICEEN 2016 where the energy cost achieved by the consumer n depends on the total energy demand and supply at time t. represents the storage cost of the prosumer which depends on both the amount of electricity bought in the market and on the energy loss due to any kind of electricity transformation. Constraints (i) summing up all the variations from the beginning of the day to any time, we cannot exceed a lower and an upper bound of the energy reserve. This constraint accounts for available energy storage media, like electric vehicle batteries or thermic accumulations due to anticipated heating, or delayed air conditioning. terms of Zt−1 by looking backwards for Zt(Yt) to the optimal energy costs at slot t − 1 for eligible values Yt − xt of the energy reserve. Finally, an optimal strategy S is any sequence such that the values of and of are computed backwards from , t = T ...,1, by letting the final reserve being . Formally: optimal strategy The time and space complexity of the algorithm are O(T Rmax k) and O(T Rmax) respectively. 3 Case study: Sicily region (ii) the sum of all the energy variations in the whole day for the consumer is zero, i.e. if in some slot the variation is positive, in some other slot it must be negative. Proposed algorithm: we propose an efficient dynamic programming algorithm for planning the energy consumption/production. Each consumer n will use the algorithm to predict and control his/her energy consumption. The control algorithm of the consumer has three inputs: (i) the definition of the class of allowed profiles Q; and (ii) the cost of a unit of energy which is the result of the negotiation in each time step of the previous day. We denote by the achieved energy cost at time t. Hereafter, the optimization problem and the proposed dynamic programming algorithm used to solve it are defined. In this section we consider the Sicily region of Italy. We model the cost associated to the power transmission system and the cost associated to the use of self-charging PV system by the prosumers. This cost information is used by the prosumer for predicting (optimizing) his/her future supply/demand (see Section 2 above). The amount of electricity produced in a region trough wind turbine or solar panel depends mainly on the geographic position and of the type of the climate. In many regions and based on the time of climate, captive consumers (households and small commercial businesses) can use renewable energy sources to produce electricity that can be made available to the power grid. Let be the optimal energy costs for time step 1,…,T when the final energy reserve at time t is Yt. Here if energy reserve Yt cannot be achieved at time step t. Thus (no slot has elapsed yet) is everywhere ∞ except for Figure 3: Sicily region: solar and wind power plants penetration Subproblems Dynamic programming The value of Zt at time t is computed sequentially in We focus our attention on the Sicily region (Figure 3) in the south of Italy which is composed of 10 regions and contents 5,092 million of habitants. In the figure, the green and red lines represent the electricity network 380−220kV in the Sicily region. The star and the square represent respectively the distribution of wind farms and solar panels in Sicily region (November 2012). In the model we study the influence of self-charging photovoltaic systems on the peak energy reduction in the power grid. In this case a part of the population, that we term prosumer, uses self-charging photovoltaic systems and do not consume additional electric power from the power grid for charging their electric vehicle. In our model, power prosumer (small businesses and households) using photovoltaic installation belongs to the first level of the DIPONET power architecture. 02002-p.3 MATEC Web of Conferences 3.1 Cost modelling Transmission cost modeling: electric power transmission and distribution losses include losses in transmission between sources of supply and points of distribution and in the distribution to consumers. The first step for the minimization of the energy losses is to focuses on the DIPONET architecture. The power transmission cost for a producer, consumer or prosumer, denoted by i, in a time period t is defined by the linear combination of the operational cost Cij in different levels j: in each hour by the entire population when there is no self-charging PV system in the Sicily region. Analogously, the solid curve represents the case in which a self-charging PV system is used by 60% of the population of Sicily (nearly 3 million of persons). The observation we have is that the consumer population when 60% (of them) makes use of the selfchanging PV system has consumed less during periods when the electricity cost is high. The peak energy reduction is about 17,91% and this is a positive result for the distribution system operator. Table 2: Experimental setup of Sicily region in the DIPONET architecture where q is the energy injected to (or withdrawn from) the power grid and r is the rate of the energy production/consumption. Self-charging PV cost modeling: the photovoltaic cost is given by the sum up of the technological investment (Cinvest) cost, the maintenance cost (Cmain) and the inefficiency cost (Cinef) due to the obscuration of the sunlight. The inefficiency cost depends on the dust deposition rate [2] which varies over a wide range both with respect to the time of the year and the location. The PV inefficiency cost during a time period t is then defined by: where α(t) represents the additional cost of inefficiency, s is the speciment type of the solar panel technology, e is the exposure period to the dust, N, Io is the light intensity, N is the number of deposited dust particle per unit area, A is the area occupied by a particle and Qext the extinction efficiency of a particle of dust (which varies from 1 to 5). 3.2 Power prosumers penetrations and electric vehicle Based on the data of the Italian GSE, in 2012 the number of photovoltaic systems in Sicily amounted to 18,846 units with a total capacity of 836.1MW. In the model captive consumers, who are able to produce electricity through alternative energy sources, are considered power prosumer and they represent the 30% of the Sicily population. Each power prosumer owns an electrical vehicle. We study the penetration of electric vehicles in the Sicily region (Figure 3) and their impact on the overall power consumption. We consider the 10 provinces of Sicily and we model them into the DIPONET power architecture. 4 Simulations We compare the behavior of the population in terms of energy consumption through a placebo test (Table 2). In the first case the population doesn’t dispose of any selfcharging PV system while in the second case they do. Figure 4 reports the result of the placebo test of the behavior of the consumer population after one day. The dashed curve represents the amount of energy consumed In Figure 5 the final cost achieved at the end of day 3 by the population of consumers in which the selfcharging PV system was active (solid curve) is less than the case in which there was no self- charging PV system (dashed curve). The energy saving cost by the penetration of EV is about 5,33% of the energy consumes by the entire population. We now consider the case in which the population is composed of power prosumer who do not care about the inelasticity demand constraint. We compare the behavior of the later population with the one who doesn’t use DIPONET. In Figure 6, we analyze the result of the placebo test in terms of energy cost achieved by all the population in different time of the day. We can notice that the two peaks energy consumption in the first case (dashed curve) have been anticipated in periods when the energy cost turns out to be low (solid curve). The peak remains high in the first case in which the population doesn’t make use of the DIPONET optimization scheme. The analysis we make is that the system operator cannot balance such a heavy change in the consumption rate of the prosumer population. Hence, the heterogeneity of the market participant (see Figure 4) in power market indirectly helps to balance the mismatch between the energy demand and supply. Figure 7 reports the result of the placebo test of the behavior of the consumer population after tree months. The population in the case in which there is a penetration of self-charging photovoltaic system (solid curve) has saved 19% of the total energy cost of the population who doesn’t (dashed curve). The information we have is that 02002-p.4 ICEEN 2016 the percentage of energy cost saving in the population keep increasing in the long run. Figure 4: EV penetration: peak energy consumption shaving by 17,91 %. Figure 7: EV penetration 3 months duration: total energy cost saving about 19%. References 1. 2. 3. Figure 5: EV penetration: total energy cost saving about 6% 4. 5. 6. Figure 6: EV penetration 1 day duration: case of only elastic power demand. 7. 5 Concluding remarks This paper proposed self-charging photovoltaic system as a solution for lowering peak energy consumption by means of distributed power networks. Our study was based on the Sicily region of Italy. We have used reinforcement learning and optimization for predicting supply/demand and store energy in a more efficient way. 02002-p.5 M. Balijepalli and K. Pradhan, “Review of Demand Response under Smart Grid Paradigm”. IEEE PES Innovative Smart Grid Tech- nologies, (2011). M. Mazumder, et al; “Characterization of electrodynamic screen performance for dust removal from solar panels and solar hydrogen generators”. IEEE Industry Applications Society Annual Meeting (IAS), (2011). R. Sutton, A. Barto, and C. Anderson, Reinforcement Learning: An Introduction, The MIT Press, 1983. Z. Ma, D. Callaway and I. Hiskens, “Decentralized charging control for large populations of plug-in vehicles, ” in Proc. Conference on Decision and Control, pp. 206-212 , (2010). U. Montanari, A. T. Siwe, Real time market models and prosumer profiling. IEEE Conference on Computer Communication Workshop, pages 712, (2013). U. Montanari, A. T. Siwe, Prosumers as Aggregators in the DEZENT Context of Regenerative Power Production IEEE International Conference on SelfAdaptive and Self-Organizing Systems (SASO), pp. 167- 174, (2014). H. Tembine, Distributed strategic learning for wireless engineers, CRC Press, Taylor & Francis Inc,(2012).


