Document 13308166
advertisement
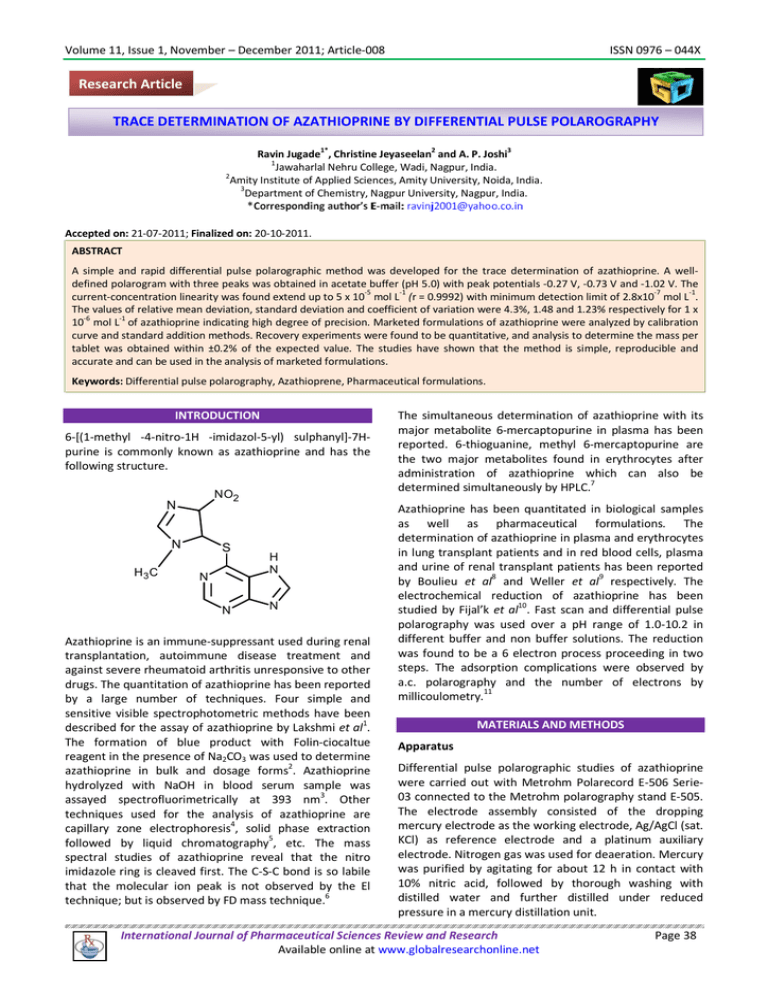
Volume 11, Issue 1, November – December 2011; Article-008 ISSN 0976 – 044X Research Article TRACE DETERMINATION OF AZATHIOPRINE BY DIFFERENTIAL PULSE POLAROGRAPHY 1* 2 3 Ravin Jugade , Christine Jeyaseelan and A. P. Joshi 1 Jawaharlal Nehru College, Wadi, Nagpur, India. 2 Amity Institute of Applied Sciences, Amity University, Noida, India. 3 Department of Chemistry, Nagpur University, Nagpur, India. Accepted on: 21-07-2011; Finalized on: 20-10-2011. ABSTRACT A simple and rapid differential pulse polarographic method was developed for the trace determination of azathioprine. A welldefined polarogram with three peaks was obtained in acetate buffer (pH 5.0) with peak potentials -0.27 V, -0.73 V and -1.02 V. The -5 -1 -7 -1 current-concentration linearity was found extend up to 5 x 10 mol L (r = 0.9992) with minimum detection limit of 2.8x10 mol L . The values of relative mean deviation, standard deviation and coefficient of variation were 4.3%, 1.48 and 1.23% respectively for 1 x -6 -1 10 mol L of azathioprine indicating high degree of precision. Marketed formulations of azathioprine were analyzed by calibration curve and standard addition methods. Recovery experiments were found to be quantitative, and analysis to determine the mass per tablet was obtained within ±0.2% of the expected value. The studies have shown that the method is simple, reproducible and accurate and can be used in the analysis of marketed formulations. Keywords: Differential pulse polarography, Azathioprene, Pharmaceutical formulations. INTRODUCTION 6-[(1-methyl -4-nitro-1H -imidazol-5-yl) sulphanyl]-7Hpurine is commonly known as azathioprine and has the following structure. NO2 N N H3C S N N H N N Azathioprine is an immune-suppressant used during renal transplantation, autoimmune disease treatment and against severe rheumatoid arthritis unresponsive to other drugs. The quantitation of azathioprine has been reported by a large number of techniques. Four simple and sensitive visible spectrophotometric methods have been described for the assay of azathioprine by Lakshmi et al1. The formation of blue product with Folin-ciocaltue reagent in the presence of Na2CO3 was used to determine azathioprine in bulk and dosage forms2. Azathioprine hydrolyzed with NaOH in blood serum sample was 3 assayed spectrofluorimetrically at 393 nm . Other techniques used for the analysis of azathioprine are 4 capillary zone electrophoresis , solid phase extraction 5 followed by liquid chromatography , etc. The mass spectral studies of azathioprine reveal that the nitro imidazole ring is cleaved first. The C-S-C bond is so labile that the molecular ion peak is not observed by the El technique; but is observed by FD mass technique.6 The simultaneous determination of azathioprine with its major metabolite 6-mercaptopurine in plasma has been reported. 6-thioguanine, methyl 6-mercaptopurine are the two major metabolites found in erythrocytes after administration of azathioprine which can also be determined simultaneously by HPLC.7 Azathioprine has been quantitated in biological samples as well as pharmaceutical formulations. The determination of azathioprine in plasma and erythrocytes in lung transplant patients and in red blood cells, plasma and urine of renal transplant patients has been reported by Boulieu et al8 and Weller et al9 respectively. The electrochemical reduction of azathioprine has been studied by Fijal’k et al10. Fast scan and differential pulse polarography was used over a pH range of 1.0-10.2 in different buffer and non buffer solutions. The reduction was found to be a 6 electron process proceeding in two steps. The adsorption complications were observed by a.c. polarography and the number of electrons by 11 millicoulometry. MATERIALS AND METHODS Apparatus Differential pulse polarographic studies of azathioprine were carried out with Metrohm Polarecord E-506 Serie03 connected to the Metrohm polarography stand E-505. The electrode assembly consisted of the dropping mercury electrode as the working electrode, Ag/AgCl (sat. KCl) as reference electrode and a platinum auxiliary electrode. Nitrogen gas was used for deaeration. Mercury was purified by agitating for about 12 h in contact with 10% nitric acid, followed by thorough washing with distilled water and further distilled under reduced pressure in a mercury distillation unit. International Journal of Pharmaceutical Sciences Review and Research Available online at www.globalresearchonline.net Page 38 Volume 11, Issue 1, November – December 2011; Article-008 Reagents and solutions All the chemicals used were of AR grade. The solutions were prepared in doubly distilled water. A pure sample of azathioprine (AZA) was obtained from RPG Life Sciences, Mumbai, India. A standard solution of azathioprine was prepared by dissolving 0.2 g of the substance in 50 mL of DMF and the volume was made up to 100 ml with DDW. The compound was insoluble in water and found to be stable for about three weeks in DMF-water mixture. However, in the present work the solution was prepared afresh every seven days. A 0.1% aqueous solution of Triton-X-100 was used to eliminate the polarographic maxima. The various buffers in which the azathioprine system was studied were Britton-Robinson buffer (pH 3.0-10.0), acetate buffer (pH 4.0-6.5), borate buffer (pH 7.5-11.0), McIlavaine buffer (pH 3.5-6.5), tetramethyl ammonium iodide (TMAI) and tetraethyl ammonium bromide (TEAB).12 General procedure An aliquot containing 40 µg of azathioprine was taken and to it was added 15 mL of the selected buffer (Acetate buffer pH 5.0), 0.5 mL of 0.1% Triton-X-100 and the total volume of the solution was made up to 25 mL having a azathioprine concentration of 5.77 x 10⁻⁶ mol L-1. The solution was deaerated with nitrogen for 20 min. The polarograms were recorded with the recorder settings as given below: Starting potential -0.0 V Potential range -1.5 V Paper speed Pulse amplitude 120 mm min-1 100 mV Scan rate Drop time Sensitivity 12 mV s-1 1s 4x 10 -9 A/ mm Mode DPP ISSN 0976 – 044X In all cases a blank recording was first performed with the base electrolyte solution, and suitable blank correction was applied in the calculations if necessary. The experiments were repeated three times to ensure reproducibility of the results. RESULTS AND DISCUSSION The evaluation of the results obtained and conclusions drawn have been considered from the first peak, which is for the reduction of the nitro group. Effect of pH The polarograms of azathioprine were recorded in different buffer systems. The peak potential (Ep) shifted towards more negative values with the increase in pH. In Britton-Robinson buffer from pH 3.0 to 4.5 an unsymmetrical peak was obtained after which it was symmetrical till pH 10.0. The change in Ep value for pH 3.0 to 10.0 was –0.16 to 0.52 V. In acetate buffer at pH 4.0 and 4.5 the peak was unsymmetrical after which it was symmetrical till pH 6.0. The change in the Ep value was from –0.22 to –0.38 V for pH 4.0 to 6.0. In borate buffer a symmetrical peak is observed over the entire pH range (7.5 to 11.0) with a shift in the Ep from –0.41 to –0.56 V. An unsymmetrical peak was obtained from pH 3.5 to 6.5 in Mcllavaine buffer but at pH 7.0 the peak was symmetrical. The change in Ep value (pH 3.5 to 7.0) was from –0.20 to –0.32 V. In Clark-Lubs buffer the Ep value changed from –0.24 to –0.52V for pH 5.0 to 10.0. An unsymmetrical peak was observed at pH 5.0 to 6.0 and at higher pH values the peak was symmetrical. A symmetrical peak was obtained in TMAI and TEAB with Ep value of –0.51 V and –0.52 V respectively. Acetate buffer (pH 5.0) was selected because it gave a narrow symmetrical peak and further studies were carried out using this buffer solution. For acetate buffer, a plot of peak current and peak potential against pH has been shown in Figure 2. -6 A typical polarogram obtained for 40 µg/25 mL (5.77x10 -1 mol.L ) of azathioprine is shown in Figure 1. The presence of the three peaks can be attributed to the reduction of the nitro group followed by desulphurization of the compound. Figure 2: Effect of pH on peak current and peak potential -6 -1 for 2.88 x 10 mol L (20µg/25 ml) of azathioprin in 0.1M acetate buffer having pH 5. Effect of maxima suppressor Figure 1: Polarogram of Acetate buffer (pH 5.0) containing 0.5ml 0.1% Triton-X-100(A) and with 5.77x10⁻⁶ mol L-1 AZA (B) The effect of maxima suppressor was studied using Triton-X-100, gelatin and bromophenol blue. It was observed that with 0.5 mL of 0.1% Triton-X-100, a narrow, International Journal of Pharmaceutical Sciences Review and Research Available online at www.globalresearchonline.net Page 39 Volume 11, Issue 1, November – December 2011; Article-008 ISSN 0976 – 044X symmetrical peak was obtained and with every 0.5 mL increase in concentration of Triton-X-100 there was about 5% decrease in the diffusion current. Gelatin (0.1%, 0.5 mL) and bromophenol blue (0.1%, 0.5 mL) gave unsymmetrical peaks as well as when no maxima suppressor was added. Hence, 0.5 mL of 0.1% Triton-X100 was selected as the optimum concentration for carrying out further studies of azathioprine. of DC polarograms were recorded at varying concentrations and E 1/4 -E3/4 was calculated which was found to be greater than 56 mV. The value of slope calculated from the graph of E versus log(I/I d -I) was 1/2 greater than 59.2 mV. The graph of Ip versus ν (ν = scan rate) did not pass through the origin, and the value of Ep also showed a change with a change in drop time. This implied that the reaction taking place was irreversible.13,14 Other parameters A calibration plot was obtained by taking increasing concentrations of azathioprine. A linear increase was observed with increasing concentration of AZA and a straight line was obtained passing through the origin. The current-concentration relation was found to be linear in the concentration range of 5 x 10⁻⁵ to 5 x 10⁻⁷ mol L-1 of AZA. The coefficient of correlation was calculated to be r = 0.9991 in this concentration range. The regression equation established in this range is Y(nA)= 20.7 X(µM) - 3.0. The lowest determinable limit of azathioprine was found to be 2.8 x 10 -7 M. The diffusion current was found to increase with increase in the drop time in the range of 0.4-2.0 s. The increase was found to be almost linear upto drop time of 1.0 s. The diffusion current showed a linear increase with increase in pulse amplitude in the range of 20-100 mV. Drop time of 1 s and pulse amplitude of 100 mV were selected for further studies. Effect of drop time on peak current has been shown in Figure 3 and effect of pulse amplitude in Figure 4. Since the Ep value obtained was in the range of 0.0 to -1.3 V, it could be concluded that it is the nitro (-NO2) group that undergoes reduction during the potential scan.15 Application Figure 3: Effect of drop time on peak current for 2.88 x 10⁻⁶ mol L-1(A) and 4.32 x 10⁻⁶ mol L-1(B) AZA The utility of the method developed was analyzed by its application to the determination of azathioprine in two marketed formulations, namely Azoran and Imuran. Twenty tablets of the drug samples were weighed and finely powdered. Powder equivalent to 100 mg of AZA were weighed accurately and dissolved in 50 ml DMF. The solution was filtered through a whatman filter paper. The filtrate and washings were collected in a 100 ml volumetric flask and the solution was made up to the mark with water. This stock solution diluted as per requirement and analyzed using calibration curve method and standard addition method. The results are shown in Table 1. Recovery experiment To determine the percentage recovery of azathioprine, a fixed quantity of azathioprine sample solution was taken and to it was added three different (10, 20, 30 µg) levels of working standard azathioprine. At each level the polarograms were recorded seven times and the amount of azathioprine was computed using the formula: Percentage recovery Figure 4: Effect of pulse amplitude on peak current for 2.88 x 10⁻⁶ mol L-1(A) and 4.32 x 10⁻⁶ mol L-1(B) AZA N XY X Y N X 2 X 2 100 where N is the number of observations, X is the amount of drug added and Y is the amount of drug obtained. The same procedure was adopted for both the marketed samples of Azathioprine at two different initial concentrations. The average percentage recovery for Azoran was 100.19% and for Imuran was 99.26%. Reversibility A graph of E versus log(I/I d -I) from a DC polarogram showed that it was a diffusion controlled process. A series International Journal of Pharmaceutical Sciences Review and Research Available online at www.globalresearchonline.net Page 40 Volume 11, Issue 1, November – December 2011; Article-008 ISSN 0976 – 044X Table 1: Determination of Azathioprine in marketed formulations Amount of Azathioprine per tablet* (mg) Drug sample Reported value Calibration curve method Standard addition method Azoran 50.0 50.40 ± 0.23 49.98 ± 0.03 Imuran 50.0 50.80 ± 0.28 50.02 ± 0.15 *(Avg ±SD) of 5 observations CONCLUSION An easy, simple and rapid DPP method is proposed for the study of azathioprine. In Acetate buffer of pH 5.0 it gives a narrow symmetrical peak and the lowest determinable -7 limit is 2.8x10 M. The polarographic reduction is diffusion controlled and irreversible. The set conditions can be applied to study marketed formulations. The mass of AZA present per tablet could also be determined. The RMD, SD and CV values obtained were 4.3%, 1.48 and 1.23% respectively. The preparation of the sample solution using the marketed formulations is also simple and no matrix effect is observed. The developed method is sensitive, convenient and can be used for routine analysis. Acknowledgement: The authors are grateful to the Alexander von Humboldt Foundation of Germany for the donation of the Metrohm Polarograph and to RPG Life Sciences, Mumbai, India for providing the drug sample. REFERENCES 1. Lakshmi CSR, Reddy MN, Spectrophotometric determination of azathioprine in pharmaceutical formulations, Talanta, 47, 1998, 1279-1286. 2. Lakshmi CSR, Reddy MN, Determination of azathioprine by using the Folin– Ciocalteu reagent, J Inst Chem India, 70, 1998, 152–155. 3. Gajewska M, Dzierzgowska A, Pawinski T, Czerwinska K, Spectrofluorimetric assay of azathioprine and 6mercaptopurine in human blood plasma, Acta Pol Pharm, 49, 1992, 13-16. 4. Shafaati A, Clark BJ, Determination of azathioprine and its related substances by capillary zone electrophoresis and its application to pharmaceutical dosage forms assay, Drug Dev Ind Pharm, 26, 2000, 267-273. 5. El-Yazigi A, Wahab A, Expedient liquid chromatographic analysis of azathioprine in plasma by use of silica solid phase extraction, Ther Drug Monit, 14, 1992, 312-316. 6. Tewari AK, Mishra A, Bhakuni DS, Mass spectral studies of azathioprine analogues, Orient J Chem, 16, 2000, 229-232. 7. Dervieux T, Boulieu R, Simultaneous determination of 6thioguanine and methyl 6-mercaptopurine nucleotides of azathioprine in red blood cells by HPLC, Clin Chem, 44, 1998, 551-555. 8. Boulieu R, Lenoir A, Bory C, High-performance liquidchromatographic determination of thiopurine metabolites of azathioprine in biological fluids, J Chromatogr Biomed Appl, 126, 1993, 352-356. 9. Weller S, Thürmann P, Rietbrock N, Gossmann J, Scheuermann EH, HPLC analysis of azathioprine metabolites in red blood cells, plasma and urine in renal transplant recipients, Int J Clin Pharmacol Ther, 33, 1995, 639-645. 10. Fijał'k Z, Chodkowski J, Warowna M, Kaniowski M, Polarographic studies of drugs of purine derivatives—II, J Pharm Biomed Anal, 7, 1989, 1853-1859. 11. Sridevi C, Reddy SJ, Electrochemical behaviour of azathioprine, Bull Electrochem, 6, 1990, 847-850. 12. Dean JA, Lange’s handbook of chemistry, 13th edition, McGraw Hill, New York, 1985, 5-104. 13. Galus Z, Fundamentals of electrochemical analysis, 1st edition, Ellis Horwood, England, 1976, 223. 14. Mishra AK, Gode KD, Polarographic assay of nitrazepam formulations, Analyst, 110, 1985, 1105-1109. 15. Henze G, Neeb R, Elektrochemische analtik, 1st edition, Springer-Verlag, Berlin, 1986, 224. About Corresponding Author: Dr. R. M. Jugade Dr. R. M. Jugade is Assistant Professor in Jawaharlal Nehru College, Nagpur. He has awarded with doctoral degree by Nagpur University and is working in the field of electro-analytical and environmental chemistry. Topics of interest are polarographic and voltammetric analysis of metal ions and pharmaceutical compounds. International Journal of Pharmaceutical Sciences Review and Research Available online at www.globalresearchonline.net Page 41
