CIPS Level 3c Summary Files
advertisement

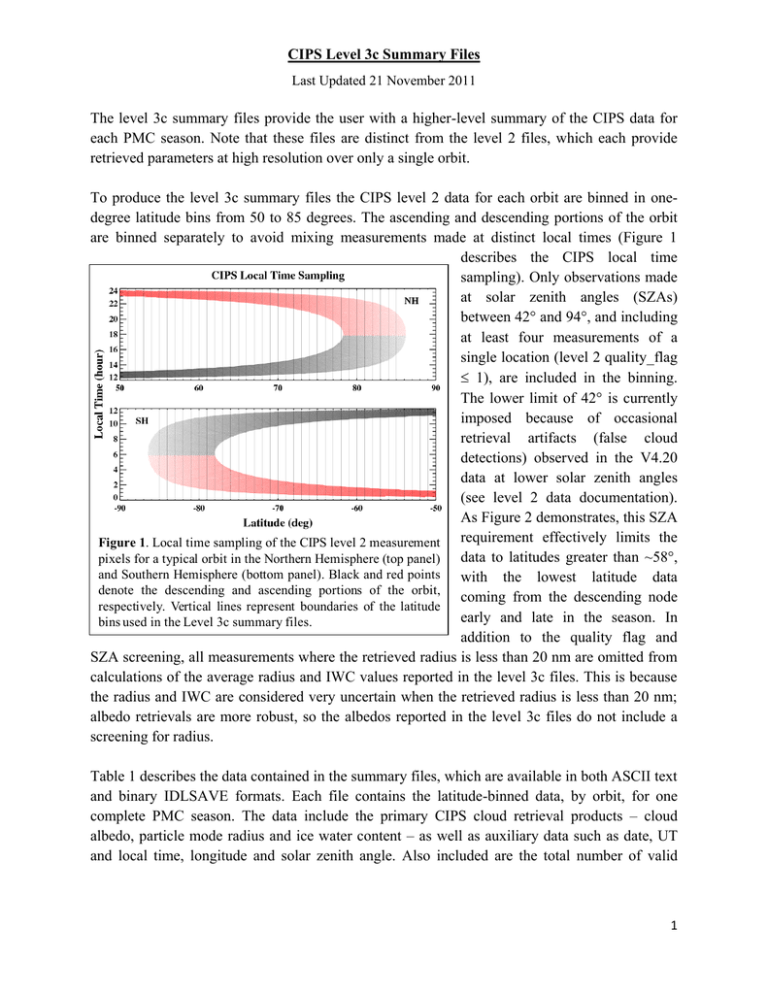
CIPS Level 3c Summary Files Last Updated 21 November 2011 The level 3c summary files provide the user with a higher-level summary of the CIPS data for each PMC season. Note that these files are distinct from the level 2 files, which each provide retrieved parameters at high resolution over only a single orbit. To produce the level 3c summary files the CIPS level 2 data for each orbit are binned in onedegree latitude bins from 50 to 85 degrees. The ascending and descending portions of the orbit are binned separately to avoid mixing measurements made at distinct local times (Figure 1 describes the CIPS local time sampling). Only observations made at solar zenith angles (SZAs) between 42° and 94°, and including at least four measurements of a single location (level 2 quality_flag 1), are included in the binning. The lower limit of 42° is currently imposed because of occasional retrieval artifacts (false cloud detections) observed in the V4.20 data at lower solar zenith angles (see level 2 data documentation). As Figure 2 demonstrates, this SZA requirement effectively limits the Figure 1. Local time sampling of the CIPS level 2 measurement data to latitudes greater than ~58°, pixels for a typical orbit in the Northern Hemisphere (top panel) and Southern Hemisphere (bottom panel). Black and red points with the lowest latitude data denote the descending and ascending portions of the orbit, coming from the descending node respectively. Vertical lines represent boundaries of the latitude early and late in the season. In bins used in the Level 3c summary files. addition to the quality flag and SZA screening, all measurements where the retrieved radius is less than 20 nm are omitted from calculations of the average radius and IWC values reported in the level 3c files. This is because the radius and IWC are considered very uncertain when the retrieved radius is less than 20 nm; albedo retrievals are more robust, so the albedos reported in the level 3c files do not include a screening for radius. Table 1 describes the data contained in the summary files, which are available in both ASCII text and binary IDLSAVE formats. Each file contains the latitude-binned data, by orbit, for one complete PMC season. The data include the primary CIPS cloud retrieval products – cloud albedo, particle mode radius and ice water content – as well as auxiliary data such as date, UT and local time, longitude and solar zenith angle. Also included are the total number of valid 1 measurements in each bin and the number of cloud detections (NUM_OBS and NUM_CLD, respectively), from which cloud frequencies can be calculated as described below. To make the summary files more useful for scientific analysis, a process of selective data screening and binning has been implemented. The data are first screened using three different cloud albedo thresholds: 110-6, 210-6 and 510-6 sr-1. As described in the level 2 data documentation each level 2 data pixel is assigned a CLD_PRESENCE value. A value of 1 means the algorithm detected a cloud and successfully retrieved Figure 2. Mean solar zenith angle sampled by CIPS during cloud parameters; a 0 indicates no the PMC season in representative latitude bins. Solid cloud was detected. For the purpose (dashed) curves correspond to the descending (ascending) of latitude binning a cloud point is part of the orbit. Horizontal lines represent the 42o and 94o defined by a CLD_PRESENCE limits used to screen the summary data. Results are representative of both hemispheres. value of 1 and a retrieved cloud albedo greater than the threshold. Similarly, a measurement having a CLD_PRESENCE value of 1 but an albedo below the threshold is interpreted as a non-cloud point (obviously a CLD_PRESENCE value of 0 indicates a non-cloud point also). These three thresholds provide the user with a full range of options for interpretation based on increasing levels of confidence in the cloud detection. The CIPS cloud detection sensitivity varies with solar zenith angle for two reasons: as the solar zenith angle increases the Rayleigh background signal decreases, while at the same time the CIPS sunward (PX) camera samples more forward-peaked scattering angles. Both of these factors enhance the discrimination between cloud and background contributions in the measured scattering profile, and hence increase detection sensitivity. Figure 3. Estimated CIPS cloud detection sensitivity. Each curve corresponds to CIPS measurements at a fixed solar zenith angle (SZA), from 35 o to 85o. For a given cloud albedo (x-axis, in units of 1G = 10-6 sr-1) the curve shows the probability of detection (in %). For example, a 5 G cloud will be detected 50% of the time at 55o SZA and 97% of the time at 85o SZA. 2 Figure 3 shows the estimated CIPS cloud detection sensitivity based on retrieval simulations. These results show that clouds with an albedo equal to the three threshold values used will have a detection probability of approximately 0, 3 and 30% at 42 deg SZA, increasing to 50, 95 and 100% at 94 deg. Thus the lowest threshold value will obviously give the highest frequencies, but will also contain more false detections. On the other hand, by using the highest threshold case the user is guaranteed to be using only the most robust CIPS cloud measurements. For each of the three albedo threshold values the data are then binned separately to produce files containing information on non-cloud data only, cloud data only, and combined cloud and noncloud (all) data. The binning methodology and primary purpose of each file are as follows: Non-cloud (“nocld” file): This file includes only non-cloud points, so all data fields pertaining to cloud parameters are set to fill values. NUM_OBS is the number of noncloud points in the bin and NUM_CLD is set to zero. This file is provided so that users have information regarding the locations and times of the cloud-free measurements. (Note: this file is generated for each cloud threshold value, despite containing no “cloud” data, because the non-cloud definition includes all points with albedo less than the threshold, as described above.) Cloud-only (“cld” file). These files include only cloud points for each threshold value, as defined above. In addition to providing the locations and times of the CIPS cloud measurements, this file quantifies directly the mean and standard deviation of the retrieved cloud parameters (albedo, particle radius and ice water content) in each bin, without “contamination” by non-cloud points. Note that this file cannot be used to calculate cloud frequencies, since NUM_OBS = NUM_CLD by definition. Cloud+non-cloud (“all” file). This file includes both cloud and non-cloud points in the binning. The PMC frequency can be calculated directly by dividing the number of clouds, NUM_CLD, by the total number of points, NUM_OBS. Besides providing cloud frequencies, these files are useful for users who wish to know the cloud parameters averaged over all space, rather than just over the cloudy areas (i.e., to give a true areaweighted average). Note that it only makes sense physically to average cloud and noncloud areas to yield an effective albedo and ice water content; this average is meaningless for the particle radius, which is thus set to the fill value. This same argument applies to the standard deviation arrays for all cloud parameters. The end result of this analysis is 9 independent files for each PMC season (“nocld”, “cld” and “all” files for each of the three albedo thresholds). These files all contain identical data fields and, in the case of the ASCII files, have identical formats. A fill value of -999 is used when a particular data field is meaningless (see explanations above), or if no valid data points exist in a given bin. The user will note that some of the lower latitude bins are never populated. This is primarily due to the solar zenith angle screening applied to the data, since the lowest latitudes are never sampled at 42o < SZA < 94o (see Figure 2). Rather than eliminating these bins from the 3 files they have been retained as placeholders because we expect that future CIPS data versions will significantly improve our data reliability at low solar zenith angles. Cautions regarding data usage are described in the CIPS Level 2 documentation. In addition, with regard to the summary files described here, users should exercise caution when average parameters are based on only a few clouds. IDL code is provided to read the ASCII files. This code should be sufficiently simple and well documented for users who do not use IDL to translate it into FORTRAN or another language. Table 1. Definition of variables in CIPS Level 3c summary file. Variable Name Units NBIN NA NREV NA LATLO LATHI REV DATE UT LTIME LON SZA NUM_CLD Degrees Degrees NA NA Hours Hours Degrees Degrees NA NUM_OBS NA RAD RAD_STD nm nm ALB ALB_STD 10-6 sr-1 10-6 sr-1 IWC IWC_STD g/m2 g/m2 Type/Dimension Description INTEGER/SCALAR Number of latitude bins (fixed at 70). INTEGER/SCALAR Total number of orbits in the season. INTEGER(NBIN) Lower latitude of bin INTEGER(NBIN) Upper latitude of bin INTEGER(NREV) AIM orbit number LONG(NREV) Date in YYYYMMDD format REAL(NREV,NBIN) Mean UT time in bin. REAL(NREV,NBIN) Mean local time in bin. REAL (NREV,NBIN) Mean longitude in bin. REAL(NREV,NBIN) Mean solar zenith angle in bin. INTEGER(NREV,NBIN) Number of pixels in bin containing clouds. INTEGER(NREV,NBIN) Total number of data points in bin. REAL(NREV,NBIN) Mean particle radius. REAL(NREV,NBIN) Particle radius standard deviation. REAL(NREV,NBIN) Mean cloud albedo. REAL(NREV,NBIN) Cloud albedo standard deviation. REAL(NREV,NBIN) Mean ice water content. REAL(NREV,NBIN) Ice water content standard deviation. ___________________________________________________________________________ Created by Jerry Lumpe and Cora Randall: May 5 2011 Updated by Jerry Lumpe: November 2011 4


