1981 1990 1992 1993
advertisement
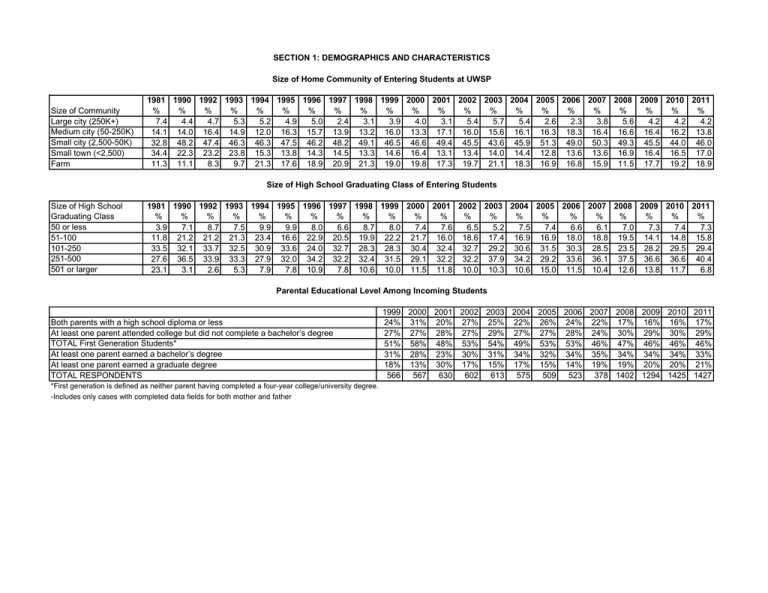
SECTION 1: DEMOGRAPHICS AND CHARACTERISTICS Size of Home Community of Entering Students at UWSP Size of Community Large city (250K+) Medium city (50-250K) Small city (2,500-50K) Small town (<2,500) Farm 1981 1990 1992 1993 1994 1995 1996 1997 1998 1999 2000 2001 2002 2003 2004 2005 2006 2007 2008 2009 2010 2011 % % % % % % % % % % % % % % % % % % % % % % 7.4 4.4 4.7 5.3 5.2 4.9 5.0 2.4 3.1 3.9 4.0 3.1 5.4 5.7 5.4 2.6 2.3 3.8 5.6 4.2 4.2 4.2 14.1 14.0 16.4 14.9 12.0 16.3 15.7 13.9 13.2 16.0 13.3 17.1 16.0 15.6 16.1 16.3 18.3 16.4 16.6 16.4 16.2 13.8 32.8 48.2 47.4 46.3 46.3 47.5 46.2 48.2 49.1 46.5 46.6 49.4 45.5 43.6 45.9 51.3 49.0 50.3 49.3 45.5 44.0 46.0 34.4 22.3 23.2 23.8 15.3 13.8 14.3 14.5 13.3 14.6 16.4 13.1 13.4 14.0 14.4 12.8 13.6 13.6 16.9 16.4 16.5 17.0 11.3 11.1 8.3 9.7 21.3 17.6 18.9 20.9 21.3 19.0 19.8 17.3 19.7 21.1 18.3 16.9 16.8 15.9 11.5 17.7 19.2 18.9 Size of High School Graduating Class of Entering Students Size of High School Graduating Class 50 or less 51-100 101-250 251-500 501 or larger 1981 1990 1992 1993 1994 1995 1996 1997 1998 1999 2000 2001 2002 2003 2004 2005 2006 2007 2008 2009 2010 2011 % % % % % % % % % % % % % % % % % % % % % % 3.9 7.1 8.7 7.5 9.9 9.9 8.0 6.6 8.7 8.0 7.4 7.6 6.5 5.2 7.5 7.4 6.6 6.1 7.0 7.3 7.4 7.3 11.8 21.2 21.2 21.3 23.4 16.6 22.9 20.5 19.9 22.2 21.7 16.0 18.6 17.4 16.9 16.9 18.0 18.8 19.5 14.1 14.8 15.8 33.5 32.1 33.7 32.5 30.9 33.6 24.0 32.7 28.3 28.3 30.4 32.4 32.7 29.2 30.6 31.5 30.3 28.5 23.5 28.2 29.5 29.4 27.6 36.5 33.9 33.3 27.9 32.0 34.2 32.2 32.4 31.5 29.1 32.2 32.2 37.9 34.2 29.2 33.6 36.1 37.5 36.6 36.6 40.4 23.1 3.1 2.6 5.3 7.9 7.8 10.9 7.8 10.6 10.0 11.5 11.8 10.0 10.3 10.6 15.0 11.5 10.4 12.6 13.8 11.7 6.8 Parental Educational Level Among Incoming Students Both parents with a high school diploma or less At least one parent attended college but did not complete a bachelor’s degree TOTAL First Generation Students* At least one parent earned a bachelor’s degree At least one parent earned a graduate degree TOTAL RESPONDENTS *First generation is defined as neither parent having completed a four-year college/university degree. -Includes only cases with completed data fields for both mother and father 1999 2000 2001 2002 2003 2004 2005 2006 2007 2008 2009 2010 2011 24% 31% 20% 27% 25% 22% 26% 24% 22% 17% 16% 16% 17% 27% 27% 28% 27% 29% 27% 27% 28% 24% 30% 29% 30% 29% 51% 58% 48% 53% 54% 49% 53% 53% 46% 47% 46% 46% 46% 31% 28% 23% 30% 31% 34% 32% 34% 35% 34% 34% 34% 33% 18% 13% 30% 17% 15% 17% 15% 14% 19% 19% 20% 20% 21% 566 567 630 602 613 575 509 523 378 1402 1294 1425 1427


