DETECT THE COASTLINE CHANGES IN THAILAND BY REMOTE SENSING
advertisement
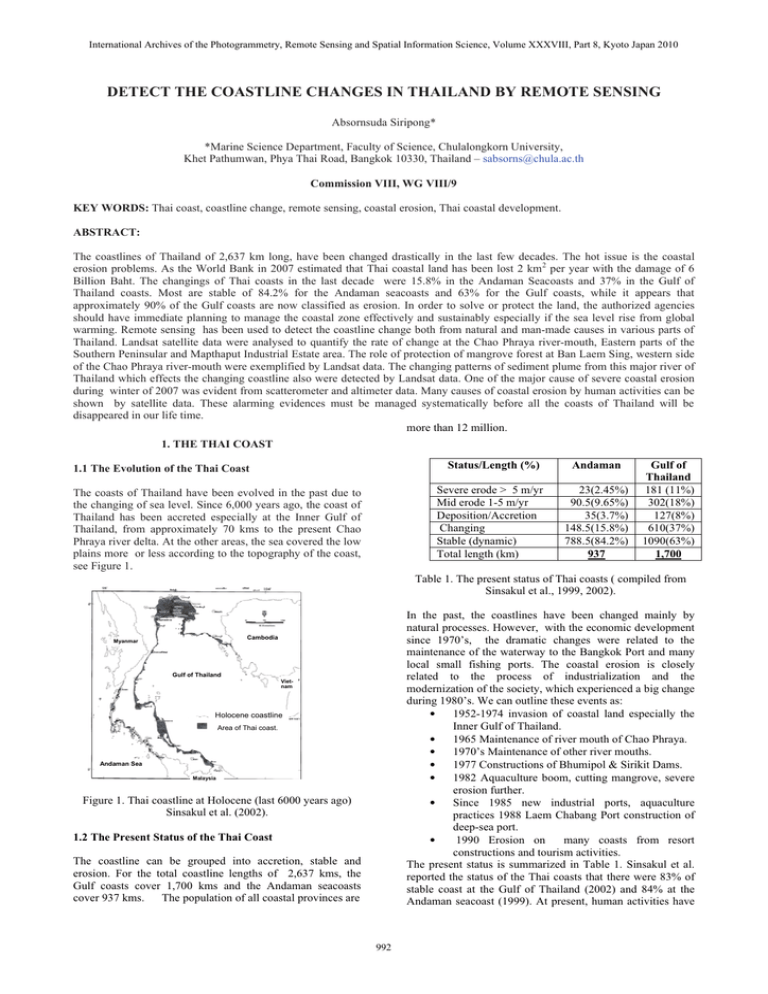
International Archives of the Photogrammetry, Remote Sensing and Spatial Information Science, Volume XXXVIII, Part 8, Kyoto Japan 2010 DETECT THE COASTLINE CHANGES IN THAILAND BY REMOTE SENSING Absornsuda Siripong* *Marine Science Department, Faculty of Science, Chulalongkorn University, Khet Pathumwan, Phya Thai Road, Bangkok 10330, Thailand – sabsorns@chula.ac.th Commission VIII, WG VIII/9 KEY WORDS: Thai coast, coastline change, remote sensing, coastal erosion, Thai coastal development. ABSTRACT: The coastlines of Thailand of 2,637 km long, have been changed drastically in the last few decades. The hot issue is the coastal erosion problems. As the World Bank in 2007 estimated that Thai coastal land has been lost 2 km 2 per year with the damage of 6 Billion Baht. The changings of Thai coasts in the last decade were 15.8% in the Andaman Seacoasts and 37% in the Gulf of Thailand coasts. Most are stable of 84.2% for the Andaman seacoasts and 63% for the Gulf coasts, while it appears that approximately 90% of the Gulf coasts are now classified as erosion. In order to solve or protect the land, the authorized agencies should have immediate planning to manage the coastal zone effectively and sustainably especially if the sea level rise from global warming. Remote sensing has been used to detect the coastline change both from natural and man-made causes in various parts of Thailand. Landsat satellite data were analysed to quantify the rate of change at the Chao Phraya river-mouth, Eastern parts of the Southern Peninsular and Mapthaput Industrial Estate area. The role of protection of mangrove forest at Ban Laem Sing, western side of the Chao Phraya river-mouth were exemplified by Landsat data. The changing patterns of sediment plume from this major river of Thailand which effects the changing coastline also were detected by Landsat data. One of the major cause of severe coastal erosion during winter of 2007 was evident from scatterometer and altimeter data. Many causes of coastal erosion by human activities can be shown by satellite data. These alarming evidences must be managed systematically before all the coasts of Thailand will be disappeared in our life time. more than 12 million. 1. THE THAI COAST 1.1 The Evolution of the Thai Coast Status/Length (%) The coasts of Thailand have been evolved in the past due to the changing of sea level. Since 6,000 years ago, the coast of Thailand has been accreted especially at the Inner Gulf of Thailand, from approximately 70 kms to the present Chao Phraya river delta. At the other areas, the sea covered the low plains more or less according to the topography of the coast, see Figure 1. Severe erode > 5 m/yr Mid erode 1-5 m/yr Deposition/Accretion Changing Stable (dynamic) Total length (km) Andaman 23(2.45%) 90.5(9.65%) 35(3.7%) 148.5(15.8%) 788.5(84.2%) 937 Gulf of Thailand 181 (11%) 302(18%) 127(8%) 610(37%) 1090(63%) 1,700 Table 1. The present status of Thai coasts ( compiled from Sinsakul et al., 1999, 2002). In the past, the coastlines have been changed mainly by natural processes. However, with the economic development since 1970’s, the dramatic changes were related to the maintenance of the waterway to the Bangkok Port and many local small fishing ports. The coastal erosion is closely related to the process of industrialization and the modernization of the society, which experienced a big change during 1980’s. We can outline these events as: • 1952-1974 invasion of coastal land especially the Inner Gulf of Thailand. • 1965 Maintenance of river mouth of Chao Phraya. • 1970’s Maintenance of other river mouths. • 1977 Constructions of Bhumipol & Sirikit Dams. • 1982 Aquaculture boom, cutting mangrove, severe erosion further. • Since 1985 new industrial ports, aquaculture practices 1988 Laem Chabang Port construction of deep-sea port. • 1990 Erosion on many coasts from resort constructions and tourism activities. The present status is summarized in Table 1. Sinsakul et al. reported the status of the Thai coasts that there were 83% of stable coast at the Gulf of Thailand (2002) and 84% at the Andaman seacoast (1999). At present, human activities have Cambodia Myanmar Gulf of Thailand Vietnam Holocene coastline Area of Thai coast. Andaman Sea Malaysia Figure 1. Thai coastline at Holocene (last 6000 years ago) Sinsakul et al. (2002). 1.2 The Present Status of the Thai Coast The coastline can be grouped into accretion, stable and erosion. For the total coastline lengths of 2,637 kms, the Gulf coasts cover 1,700 kms and the Andaman seacoasts cover 937 kms. The population of all coastal provinces are 992 International Archives of the Photogrammetry, Remote Sensing and Spatial Information Science, Volume XXXVIII, Part 8, Kyoto Japan 2010 caused the higher rate and more permanent coastal erosion on more than 80% of the total coastline. At the same time, the stable coasts are left lesser and lesser. of the sediment along the east side of the Chao Phraya Rivermouth. However, during the northeast monsoon and peak river discharge on 10 October 1990 (Figure 5, lower image), The large plume of river sediment extended further to the sea and some deposited on the west side of the river-mouth. 2. DETECT THE COASTLINE CHANGE. Remote sensing is a useful tool to detect coastline change. In Thailand, the author has used many kinds of satellite data to detect the coastline change and find the causes of the coastline change especially coastal erosion. 2.1 The Coastline Rivermouth. Change at the Chao Phraya Landsat satellite data has been used to detect the coastline change at this delta area (Figure 2). The cutting of mangrove trees for converting to the fish and shrimp ponds and human settlement is one cause of coastal erosion in this area. The land-use changes are the evidence of the impact of human activities on coastline change (Figures 3 and 6). Extensive cutting of mangrove area promotes erosion rate. Where the mangrove trees were preserved such as at the Naval Base, the coastline has been accreted instead of erosion (Figure 4). The high rate of subsidence due to sediment load and pumping underground water is very high about 55 cm per 17 years (1978-1995) at the Naval Base. The constructions of major dams in the upper land have prevent the sediment to the sea and promote erosion. The ineffective coastal protections such as sea wall, breakwater, sand sausage and groyne also accelerate the erosion rate. Figure 4. Coastline changes from 1974 to 1999, W side of Chao Phraya River-mouth from Landsat. Figure 5. Relationship of sediment plume with river runoff and monsoon wind at Chao Phraya River-mouth from Landsat. Figure 2. Shoreline change from 1987 (red) to 2002 (white) from Landsat data. 122 Figure 3. Rate of shoreline change from 1987 – 2002 interpreted from Landsat imageries at 30 meter resolution. Figure 6. Landuse change at the Chao Phraya River-mouth. The patterns of sediment plume from this river during the peak and low river discharge were analyzed to study the effects of river discharge and monsoon wind pattern on coastline accretion and erosion (Figure 5). During southwest monsoon and low river discharge, on 4 May 1989 (Figure 5, upper image), the wave-driven current showed the deposition 2.2 The Coastline Change at Map Ta Phut Industrial Estate, Rayong. The Map Ta Phut Industrial Estate is the largest Petrochemical industrial Complex in Thailand. It is situated 993 International Archives of the Photogrammetry, Remote Sensing and Spatial Information Science, Volume XXXVIII, Part 8, Kyoto Japan 2010 on the coast of Rayong province since 1989. After construction of the big sea ports, reclaimed lands, and other coastal activities, the coastlines have been changed drastically. The Landsat images in 1988, 1994 and 2000 before and after the constructions of the reclaimed lands were used to study the coastline changes by image difference method. The result show that the accretion and erosion of the western coastline during this period were estimated as 5,250 and 6,975 metre2 per year, while the eastern coastline were 4,650 and 11,400 metre2 per year (see Figures 8 and 9). The 8 Landsat images were analysed by colour density slicing method to detect the effect of monsoon wind on sediment distribution which can cause accretion and deposition of the coast here. 10 2537 - 5 2531 ( ) 12 2543 - 5 2531 ( ) 15000 20000 10000 10000 5000 () 0 -4000 -3000 -2000 -1000 0 1000 2000 3000 () 0 4000 -4000 -3000 -2000 -1000 0 1000 2000 3000 4000 -5000 -10000 -10000 -20000 -15000 Area change (m2) of Maptaput before reclaim (5 Aug. 1988) & after reclaim phase 1 (10 Nov. 1994). ( ) 12 2543 - 5 2531 30000 20000 10000 () 0 -4000 -3000 -2000 -1000 0 1000 2000 3000 4000 -10000 -20000 -30000 Area change (m2) of Maptaput after reclaim phase 1 (10 Nov. 1994) & phase 2 (12 Dec. 2000). Area change (m2) of Maptaput before reclaim (5 Aug. 1988) & after reclaim phase 2 (12 Dec.2000). Figure 9. Quantified area changes before and after construction of the reclaimed lands at Map Ta Phut by Landsat. 2.3 The Coastline Change Along the East Coast of Southern Peninsular Thailand. Mapping Coastline Change Using remote Sensing Landsat and THEOS Images were used to detect the coastline changes in this area. It is revealed that human activities are the main cause of coastline change especially coastal erosion than natural causes. Map Ta Phut, Rayong 3 9 7 Figure 7 Coastline change 1987 – 1999 from Landsat showing the effect of harbour development at Map Ta Phut, Rayong province. erosion Coastline changes accretion erosion erosion erosion erosion 2 Sept 2002 11 Apr. 1998 accretion 26 Dec. 1999 accretion accretion 28 Dec. 1994 10 Jan. 1988 accretion accretion 26 Dec. 1987 Result of image difference before reclaim (5 Aug. 1988) & after reclaim phase 1 (10 Nov. 1994) Coastline change, Laem Pukbia, 64 Phetburi from 1987 to 2002 Result of Image difference after reclaim phase 1 (10 Nov. 1994) & phase 2 (12 Dec. 2000) Figure 10. Coastline change at Laem (spit) Pukbia, Phet-buri province from 1987 to 2002, by LANDSAT. Methawee NuanLa-ong erosion erosion accretion accretion Result of Image difference before reclaim (5 Aug 1988) & after (phase 2, 12 Dec. 2000) &RDVWOLQHFKDQJHDW .DR7DJLHE3UDFKXDE .KLUL .KDQIURP WRE\/$1'6$7 Figure 8. Effect of the constructions of the reclaimed lands from landsat on coastline changes at Map Ta Phut . Coastline changes at Prachuab Khiri Khan 2 Sept 2002 11 Apr 1998 26 Dec. 1999 28 Dec. 1994 25 Dec. 1987 Figure 11. Coastline change at Ta-gieb Hill, Prachuab Khiri Khan Province from 1987 to 2002 by Landsat. 994 International Archives of the Photogrammetry, Remote Sensing and Spatial Information Science, Volume XXXVIII, Part 8, Kyoto Japan 2010 The Thai satellite THEOS image show the effect of engineering constructions such as groynes, seawalls, offshore breakwaters and jetty on coastline change at Rayong. It is need to assess the effect of these strucures on coastline before construction, otherwise, it is too much expensive for the remedy program. 2.4 The Catastrophic Coastal Erosion from Cold Surge. The wind patterns fromQuikSCAT/Sea Winds and sea surface height anomaly or wave data from satellite altimeter were used to detect the catastrophic coastal erosion on 20 December 2006 along the east coasts of Southern Thai Peninsular (Figure 14). The strong Cold Surge from northeast caused very high waves which attacked furiously on the Thai and Malaysian coasts and caused severe coastal erosion. 20 December 2006 evening pass Figure 12. Coastline change at Cha-um, Phetburi province from 1987 – 2002, by Landsat showing effect of jetty. 20 December 2006 morning pass SSHA 20 Dec. 2006 QuikSCAT/SeaWinds Figure 14. The QuilSCAT/SeaWinds and SSHA data on 20 December 2006. 2.5 Effects of Sea Level Rise at Songkla Lake Basin The effect of sea level rise at the Songkla Lake basin was studied by Tanavud & Chusrinuan (personal communication) The inundation areas due to sea level rise in a 0.5, 1 and 3 m sea level rise scenarios, They estimated the impact of sea level rise on Songkla Lake Basin using 3 scenarios overlay on 1975 aerial photographs and 2006 Landsat-5 TM imageries in GIS environment to identify the sectors along the basin coastline where the shoreline position has been changed over the last 31 years. Figure 13. Effect of engineering hard structures on coastline change on 19 January 2009 by THEOS images. The construction of seawall at Laem Pukbia, Phetburi province, in Figure 10 caused the spit, which normally is the accretional coast to be eroded after construction because of scouring and beach drawdown. The construction of seawall and few small fishing ports at Ta-gieb Hill, Prachuap Khiri Khan province in Figure 11 caused downdrift erosion from the hill. After the construction of the jetty at Cha-um, Phetburi province, the deposition occur at the downdrift and erosion at the updrift on the longshore sediment transport, as shown from Landsat images in Figure 12. Figure 15. Effect of sea level rise in 0.5, 1 and 3 m scenarios on coastal resources and morphology of the Songkla Lake using Landsat and aerial photographs. 995 International Archives of the Photogrammetry, Remote Sensing and Spatial Information Science, Volume XXXVIII, Part 8, Kyoto Japan 2010 The Gulf Seacoast of Thailand, Technical Department of Mineral Resources, 173 pp. Report, 5. ACKNOWLEDGEMENT All of the satellite data were kindly provided to the author from GISTDA (Geo-Informatics and Space Technology Development Agency) (Public Organization), Ministry of Science and Technology, Thailand. Table 2. Inundation area under each sea level rise scenarios. Table 3. Inundated area of major geomorphological features on Songkla Lake coast under three sea level rise scenarios Table 4. Inundation area on coastal land use type at Songkla Lake basin under three different sea level rise scenarios. 3. CONCLUSIONS The seacoast is an important natural resource of the world. We should protect this fragile environment for optimal uses. The satellite data are shown be a powerful tool to detect the coastline changes in Thailand. With environmental data such as wind, river discharge, human activities, we can study the causes of the coastline change and make appropriate coastal zone management policy to protect the coasts effectively and sustainably. 4. REFERENCES Sinsakul, Sin, Tiyapairat, Suwat, Chaimanee, Nirand & Aramprayoon, Aram, 1999. The Changing Coastal Area At The Andaman Seacoast of Thailand, Technical Report, Department of Mineral Resources, 58 pp. Sinsakul, Sin, Tiyapairat, Suwat, Chaimanee, Nirand & Aramprayoon, Aram, 2002. The Changing Coastal Area At 996
