Sector Outlook 3. Dress for the presentation is business professional.
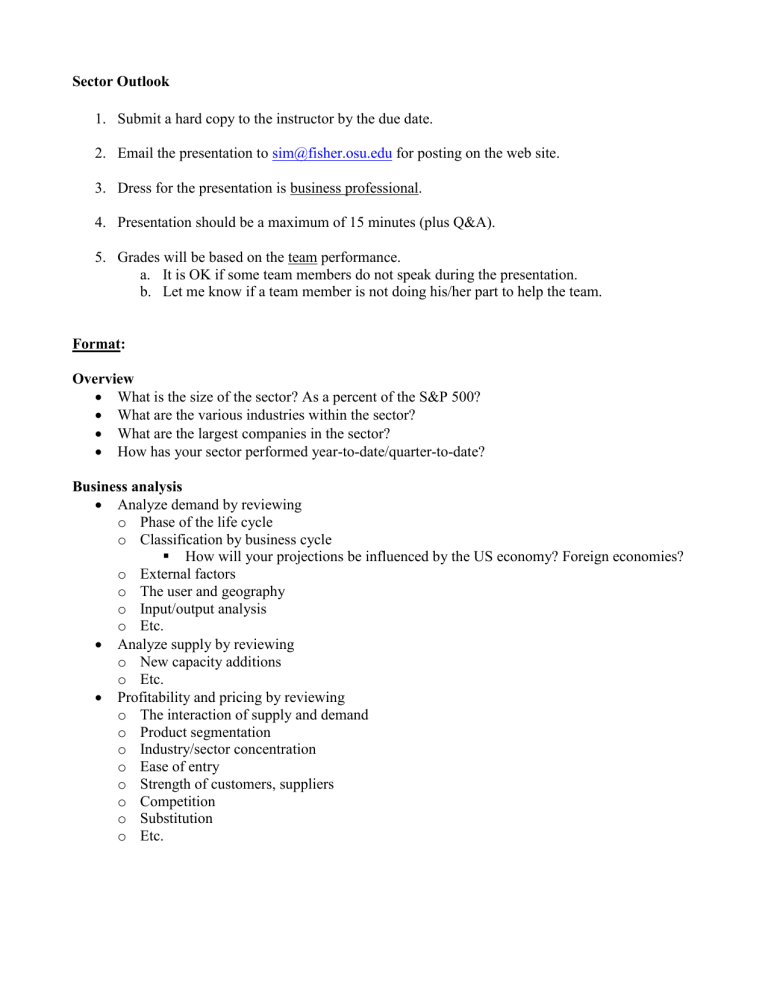
Sector Outlook
1.
Submit a hard copy to the instructor by the due date.
2.
Email the presentation to sim@fisher.osu.edu
for posting on the web site.
3.
Dress for the presentation is business professional.
4.
Presentation should be a maximum of 15 minutes (plus Q&A).
5.
Grades will be based on the team performance. a.
It is OK if some team members do not speak during the presentation. b.
Let me know if a team member is not doing his/her part to help the team.
Format:
Overview
What is the size of the sector? As a percent of the S&P 500?
What are the various industries within the sector?
What are the largest companies in the sector?
How has your sector performed year-to-date/quarter-to-date?
Business analysis
Analyze demand by reviewing o Phase of the life cycle o Classification by business cycle
How will your projections be influenced by the US economy? Foreign economies? o External factors o The user and geography o Input/output analysis o Etc.
Analyze supply by reviewing o New capacity additions o Etc.
Profitability and pricing by reviewing o The interaction of supply and demand o Product segmentation o Industry/sector concentration o Ease of entry o Strength of customers, suppliers o Competition o Substitution o Etc.
Economic analysis
Regression analysis is often useful for sectors/stocks that are highly correlated to a particular economic (or other) data statistics. For example, oil prices and Energy stock prices are highly correlated.
Financial analysis
What are the sales and earnings growth rates of the sector, industry, major companies? How do these rates compare to history?
Other o What are margins? Operating? Net? R&D as a percent of sales? ROE? Turnover? Etc. o How do current and future margins compare to the past? o Is the sector a net user of cash or does it generate free cash flow? o Are margins expanding, contracting, or remaining the same? Versus the market (e.g. S&P
500) o Etc.
Valuation analysis (assignment #4)
Consider P/E, P/S, P/B, P/CF, etc.
Does valuation vary widely across the sector from industry to industry and company to company?
Consider the P/E, P/S, P/B, P/CF, etc. of the sector and industries versus the market
If the relative valuations (above) have expanded/contracted over the years then tell us why
Do you think that valuations will expand, contract or remain the same for this group? Versus the market? Why?
What does technical analysis (i.e. the charts) suggest? (e.g. is support/resistance forming, do you see trends?, etc.)
Recommendation
Should the SIM portfolio over or underweight the sector relative to the S&P 500?
What are the major positives that you foresee and the biggest risks to your recommendation?
Within your sector, which industries would you over and underweight versus the S&P 500?
Why?
Class Vote
Majority rules.
Helpful Tip:
Review the prior quarter presentations on the web site for help with format and ideas.

