Box B: Comparing Australian and US Equity Returns
advertisement

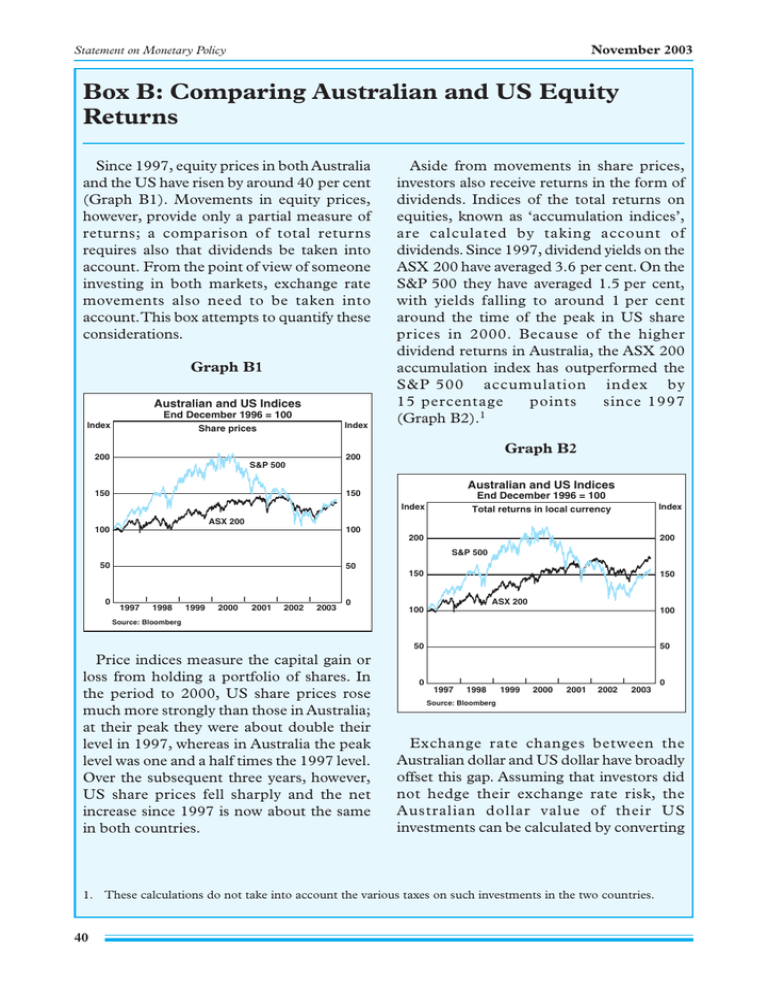
November 2003 Statement on Monetary Policy Box B: Comparing Australian and US Equity Returns Since 1997, equity prices in both Australia and the US have risen by around 40 per cent (Graph B1). Movements in equity prices, however, provide only a partial measure of returns; a comparison of total returns requires also that dividends be taken into account. From the point of view of someone investing in both markets, exchange rate movements also need to be taken into account. This box attempts to quantify these considerations. Graph B1 Australian and US Indices End December 1996 = 100 Index Index Share prices 200 Aside from movements in share prices, investors also receive returns in the form of dividends. Indices of the total returns on equities, known as ‘accumulation indices’, are calculated by taking account of dividends. Since 1997, dividend yields on the ASX 200 have averaged 3.6 per cent. On the S&P 500 they have averaged 1.5 per cent, with yields falling to around 1 per cent around the time of the peak in US share prices in 2000. Because of the higher dividend returns in Australia, the ASX 200 accumulation index has outperformed the S&P 500 accumulation index by 15 percentage points since 1997 (Graph B2).1 Graph B2 200 S&P 500 150 Australian and US Indices 150 End December 1996 = 100 Index Index Total returns in local currency ASX 200 100 100 200 200 S&P 500 50 50 150 0 l 1997 l 1998 l 1999 l 2000 l 2001 l 2002 2003 150 ASX 200 0 100 100 Source: Bloomberg 50 Price indices measure the capital gain or loss from holding a portfolio of shares. In the period to 2000, US share prices rose much more strongly than those in Australia; at their peak they were about double their level in 1997, whereas in Australia the peak level was one and a half times the 1997 level. Over the subsequent three years, however, US share prices fell sharply and the net increase since 1997 is now about the same in both countries. 0 50 l 1997 l 1998 l 1999 l 2000 l 2001 l 2002 2003 Exchange rate changes between the Australian dollar and US dollar have broadly offset this gap. Assuming that investors did not hedge their exchange rate risk, the Australian dollar value of their US investments can be calculated by converting 1. These calculations do not take into account the various taxes on such investments in the two countries. 40 0 Source: Bloomberg Reserve Bank of Australia the US accumulation index into Australian dollars at the prevailing exchange rate. Doing so suggests that investing in the domestic share market was broadly similar to investing overseas over this period (Graph B3). Finally, comparisons of equity markets’ performance should also take account of differences in risk. Due to the lower price volatility of the Australian market during the past seven years, whether measured on localcurrency or common-currency terms, the Australian market has outperformed the US market on a risk-adjusted basis. R November 2003 Graph B3 Australian and US Indices End December 1996 = 100 Index Index Total returns in Australian dollars 300 300 S&P 500 200 200 ASX 200 100 100 l 0 1997 l 1998 l 1999 l 2000 l 2001 l 2002 2003 0 Sources: Bloomberg; RBA 41


