Characterization of single pixel evaluation PIV for precise flow measurement H.-S. Chuang
advertisement

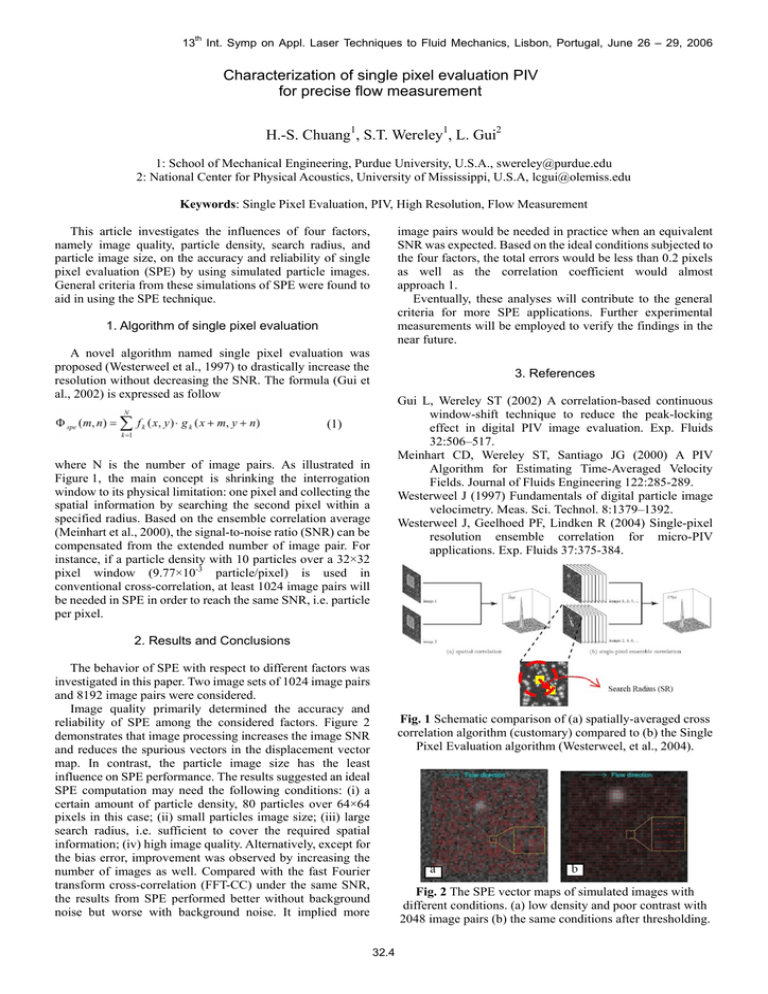
13th Int. Symp on Appl. Laser Techniques to Fluid Mechanics, Lisbon, Portugal, June 26 – 29, 2006 Characterization of single pixel evaluation PIV for precise flow measurement H.-S. Chuang1, S.T. Wereley1, L. Gui2 1: School of Mechanical Engineering, Purdue University, U.S.A., swereley@purdue.edu 2: National Center for Physical Acoustics, University of Mississippi, U.S.A, lcgui@olemiss.edu Keywords: Single Pixel Evaluation, PIV, High Resolution, Flow Measurement image pairs would be needed in practice when an equivalent SNR was expected. Based on the ideal conditions subjected to the four factors, the total errors would be less than 0.2 pixels as well as the correlation coefficient would almost approach 1. Eventually, these analyses will contribute to the general criteria for more SPE applications. Further experimental measurements will be employed to verify the findings in the near future. This article investigates the influences of four factors, namely image quality, particle density, search radius, and particle image size, on the accuracy and reliability of single pixel evaluation (SPE) by using simulated particle images. General criteria from these simulations of SPE were found to aid in using the SPE technique. 1. Algorithm of single pixel evaluation A novel algorithm named single pixel evaluation was proposed (Westerweel et al., 1997) to drastically increase the resolution without decreasing the SNR. The formula (Gui et al., 2002) is expressed as follow 3. References Gui L, Wereley ST (2002) A correlation-based continuous window-shift technique to reduce the peak-locking effect in digital PIV image evaluation. Exp. Fluids 32:506–517. Meinhart CD, Wereley ST, Santiago JG (2000) A PIV Algorithm for Estimating Time-Averaged Velocity Fields. Journal of Fluids Engineering 122:285-289. Westerweel J (1997) Fundamentals of digital particle image velocimetry. Meas. Sci. Technol. 8:1379–1392. Westerweel J, Geelhoed PF, Lindken R (2004) Single-pixel resolution ensemble correlation for micro-PIV applications. Exp. Fluids 37:375-384. (1) where N is the number of image pairs. As illustrated in Figure 1, the main concept is shrinking the interrogation window to its physical limitation: one pixel and collecting the spatial information by searching the second pixel within a specified radius. Based on the ensemble correlation average (Meinhart et al., 2000), the signal-to-noise ratio (SNR) can be compensated from the extended number of image pair. For instance, if a particle density with 10 particles over a 32×32 pixel window (9.77×10⁻³ particle/pixel) is used in conventional cross-correlation, at least 1024 image pairs will be needed in SPE in order to reach the same SNR, i.e. particle per pixel. 2. Results and Conclusions The behavior of SPE with respect to different factors was investigated in this paper. Two image sets of 1024 image pairs and 8192 image pairs were considered. Image quality primarily determined the accuracy and reliability of SPE among the considered factors. Figure 2 demonstrates that image processing increases the image SNR and reduces the spurious vectors in the displacement vector map. In contrast, the particle image size has the least influence on SPE performance. The results suggested an ideal SPE computation may need the following conditions: (i) a certain amount of particle density, 80 particles over 64×64 pixels in this case; (ii) small particles image size; (iii) large search radius, i.e. sufficient to cover the required spatial information; (iv) high image quality. Alternatively, except for the bias error, improvement was observed by increasing the number of images as well. Compared with the fast Fourier transform cross-correlation (FFT-CC) under the same SNR, the results from SPE performed better without background noise but worse with background noise. It implied more Fig. 1 Schematic comparison of (a) spatially-averaged cross correlation algorithm (customary) compared to (b) the Single Pixel Evaluation algorithm (Westerweel, et al., 2004). Fig. 2 The SPE vector maps of simulated images with different conditions. (a) low density and poor contrast with 2048 image pairs (b) the same conditions after thresholding. 32.4


