A) B) FIGURE 59a. Stability relations among some iron compounds in...
advertisement
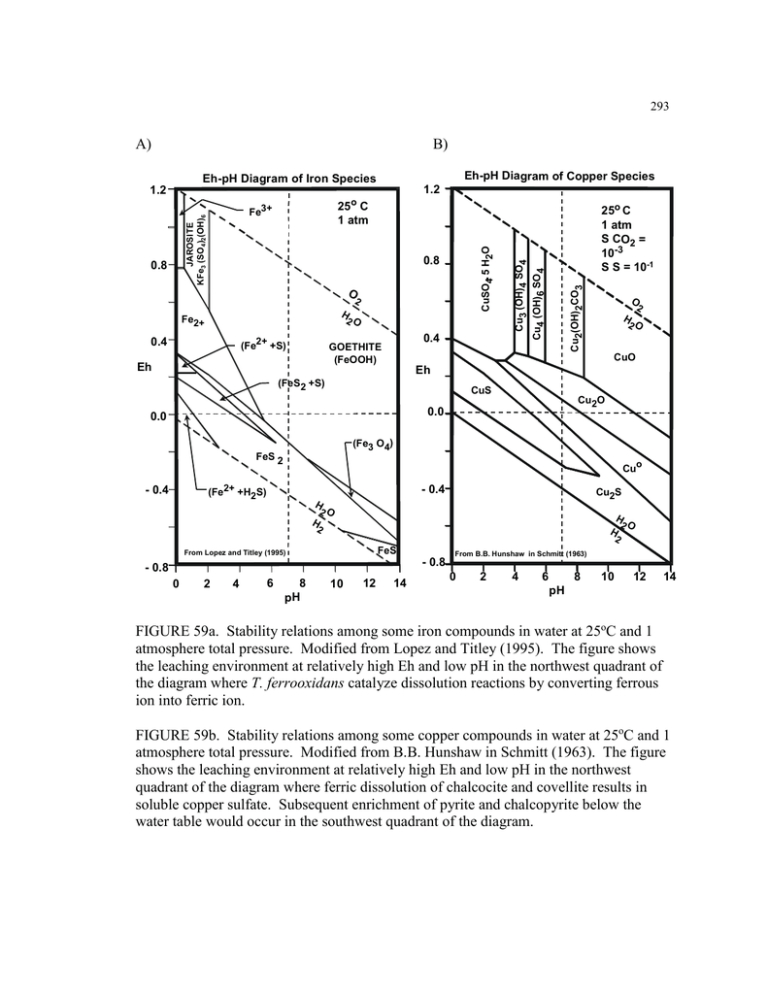
293 A) B) Eh-pH Diagram of Copper Species Eh-pH Diagram of Iron Species 1.2 1.2 2 H Fe2+ 2O 0.4 (Fe2+ +S) 0.4 GOETHITE (FeOOH) Eh Cu2(OH)2CO3 O Cu3 (OH)4 SO4 0.8 25o C 1 atm S CO2 = 10-3 S S = 10-1 Cu4 (OH)6 SO4 CuSO4. 5 H2O JAROSITE KFe3 (SO4)2(OH)6 0.8 25o C 1 atm Fe3+ O 2 H 2O CuO Eh (FeS2 +S) CuS Cu2O 0.0 0.0 (Fe3 O4) FeS 2 Cuo (Fe2+ +H2S) - 0.4 - 0.4 Cu2S H 2O H 2O H H 2 2 FeS From Lopez and Titley (1995) From B.B. Hunshaw in Schmitt (1963) - 0.8 - 0.8 0 2 4 6 8 pH 10 12 14 0 2 4 6 8 10 12 14 pH FIGURE 59a. Stability relations among some iron compounds in water at 25oC and 1 atmosphere total pressure. Modified from Lopez and Titley (1995). The figure shows the leaching environment at relatively high Eh and low pH in the northwest quadrant of the diagram where T. ferrooxidans catalyze dissolution reactions by converting ferrous ion into ferric ion. FIGURE 59b. Stability relations among some copper compounds in water at 25oC and 1 atmosphere total pressure. Modified from B.B. Hunshaw in Schmitt (1963). The figure shows the leaching environment at relatively high Eh and low pH in the northwest quadrant of the diagram where ferric dissolution of chalcocite and covellite results in soluble copper sulfate. Subsequent enrichment of pyrite and chalcopyrite below the water table would occur in the southwest quadrant of the diagram.
