KfW Chennai BRT 140212
advertisement
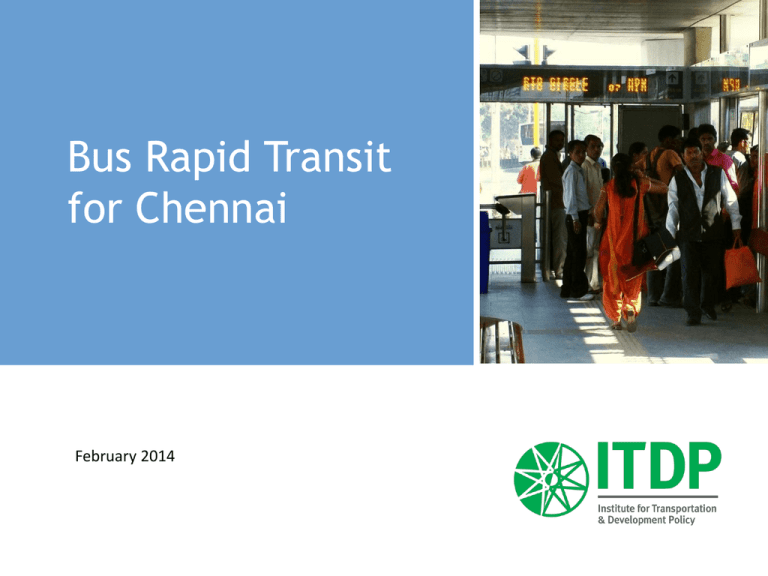
Bus Rapid Transit for Chennai February 2014 Chennai city bus service GOOD PATRONAGE 50 lakh daily passenger trips 3650 buses Maximum flow of 14400 pphpd 5000-10000 pphpd on many corridors BUT Buses are overcrowded Average speed is low ~16kmph No integration with other modes Demand for public transport by 2017 Population of CMA is expected to be 10.5 million people Tamil Nadu government's stated goal for public transport mode share of 40% of all trips (incl. walk and cycle) To achieve this goal, public transport should have a capacity of 11million trips per day. If this capacity is not build in the form of high-capacity highquality public transport, stated goal will not be achieved. • Rail systems will be able to serve only around 2.5 million trips • Bus based transport would have to serve ~7 million trips • Paratransit and taxi services will account for the remaining trips 18000 lane-km of new roads! Investment: Rs.36,000 cr 3500 new buses 80km BRT NMT MMI Parking Investment: Rs.3,000 cr Mode Shift 2013 – 2018 Goal PT to achieve 60% motorized modes Projects in Action Chennai Street Revitalization Program Chennai NMT Policy - Vision •Chennai will be a city with a general sense of well-being through the development of quality and dignified environment where people are free to walk and cycle; equitable allocation of public space and infrastructure; and access to opportunities and mobility for all residents. Chennai Cycle Sharing • 158 cycle sharing stations sited near: – Rapid transit stations – Commercial centres, colleges, parks, cultural destinations – Areas without public transport access • 3 sizes: – Large: 60 docks or parking area – Medium: 30 docks – Small: 15 docks • 3,090 cycles Developing an Integrated, High Quality Bus & BRT Network OBJECTIVES 1. Expansion of the bus fleet to better serve existing demand and expand public transport usage. 2. Implement BRT to expand the reach of mass rapid transit. 3. Provide better information to enhance public transport user experience. 4. Simplify fare collection and integrate it across modes 684 7000 6000 1,800 5000 4000 2000 1000 3,400 3000 883 Enhancing City Bus Fleet & Quality BUS FLEET REQUIREMENT: Yr 2014: 5,000 0 Existing For comfortable Due to Shift from Reduction journey share autos because of route rationalisation 26% 64% Chennai BRT Phase-1 80 km network INR 11 billion investment 1.5 million trips/day (2016) High quality stations | Real-time information Smart electronic fare collection at stations Rapid | Dependable Easy to access Chennai BRT corridors Corridor Maduravoyal – CMBT Passengers per hour per direction Length (km) 14.0 3,300 7.7 9,200 CMBT – Madhavaram 12.4 3,100 Siruseri – Saidapet 24.8 8,200 Tambaram – Airport 10.5 7,900 GST Road Junction – Thoraipakkam 10.6 1,800 Total 80.0 Ambattur – Thirumangalam Implementation costs Corridor Maduravoyal – CMBT Length (km) Cost (crore Rs) 14.0 196 7.7 108 CMBT – Madhavaram 12.4 149 Siruseri – Saidapet 24.8 372 Tambaram – Airport 10.5 158 GST Road Junction – Thoraipakkam 10.6 127 Total 80.0 1,110 Ambattur – Thirumangalam 100 Feet Rd near Padi: existing 100 Feet Rd near Padi: proposed OMR BRT corridor: existing OMR BRT corridor: proposed Passing lanes increase system capacity Integration with metro & MRTS From/to Metro Drop-off Link Bridge From/to street Drop-off From/to street BRT Ensuring quality: The BRT Standard Effective PPP structure Government (SPV) • Sets operating parameters • Monitors system performance • Receives all fare revenue • Reimburses operators for services performed (with penalties, where applicable) Private bus operator • Operates the buses • Carries out maintenance Fare collection operator • Issues tickets and collects revenue Other operators • Station maintenance, security, etc SPV structure Board of Directors Managing Director Planning & design • Route planning • Infrastructure design • Business model • Financial analysis • Long-term vision • • • • Operations Admin & finance Scheduling Fleet monitoring Fare collection Quality control • Financial management • Contracting & payments • Human resources • Physical resources • Legal Communications and marketing • Public information strategy • User surveys • Corporate identity • Marketing • Media relations Implementation timeline year 1 year 2 year 3 SPV formation Design consultants Infrastructure contract Bus operations contract Bus procurement IT contract IT procurement Testing Marketing VISION 2023 Questions?

