CP Chapter 7 - Madeira City Schools
advertisement
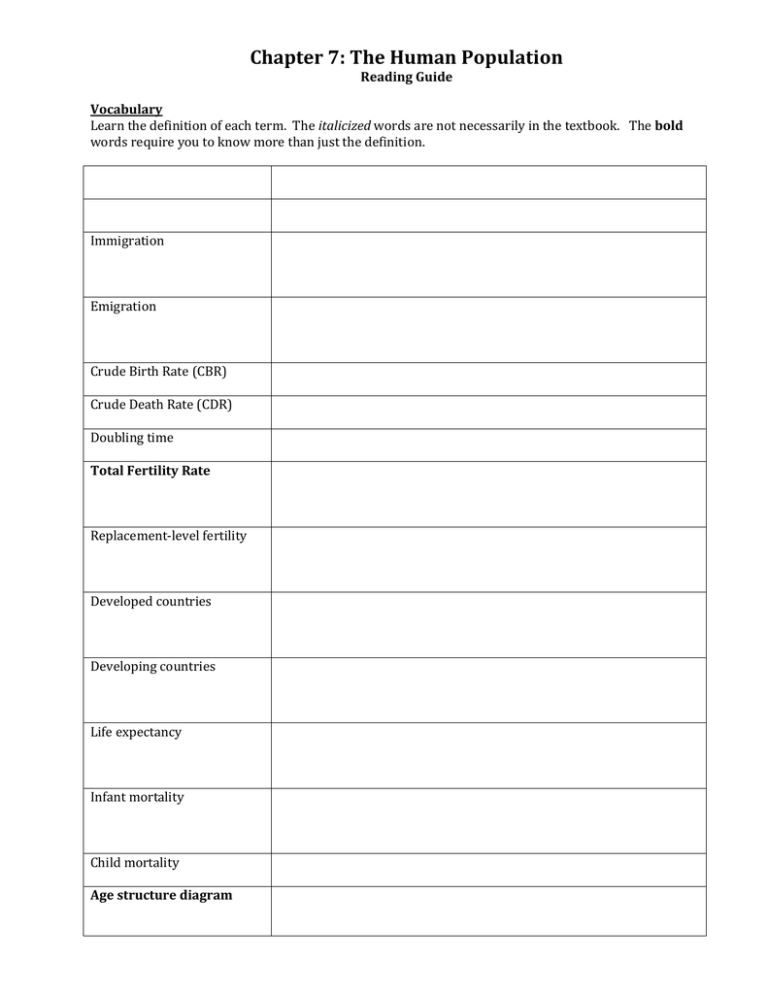
Chapter 7: The Human Population Reading Guide Vocabulary Learn the definition of each term. The italicized words are not necessarily in the textbook. The bold words require you to know more than just the definition. Immigration Emigration Crude Birth Rate (CBR) Crude Death Rate (CDR) Doubling time Total Fertility Rate Replacement-level fertility Developed countries Developing countries Life expectancy Infant mortality Child mortality Age structure diagram Population pyramid Demographic transition Family planning Urban area (census definition) Gross domestic product (GDP) The Environmental Implications of China’s Growing Population 1. What is affluence? Look it up if you do not know. 2. At the moment, who is more affluent: the US or China? Why is China’s increasing affluence of such concern? 3. Briefly describe China’s One Child Policy. Is it working? 7.1 Scientists disagree on Earth’s carrying capacity 4. Who is Thomas Malthus and what did he have to say on carrying capacity? 5. List some potential limiting factors for the human populations. 6. How could technology help humans overcome limiting factors? Give a few examples from the past. 7.2 Many factors drive human population growth 7. Fill in the table below comparing some demographic indicators in a developed versus a developing country Indicator Description Developed Developing country country Total Fertility Rate The total number of children a Low (~2.1) Higher (>2.5) (TFR) woman will have in her lifetime Replacement Level Fertility (RLF) Life expectancy (LE) Infant Mortality Rate (IMR) Child Mortality Rate (CMR) 8. TFR and RLF can help us understand how a population will change: a. If TFR > RLF, then the population is likely ____________________________________ b. If TFR = RLF, then the population is likely ____________________________________ c. If TFR < RLF, then the population is likely ____________________________________ 9. What factors influence infant mortality rate and life expectancy? 10. Why is death rate not always a useful indicator of a country’s standard of living? (Use the US and Mexico example) 11. Where is HIV/AIDS having the biggest impact on population? 12. Label the following population pyramids/age structure diagrams as likely to grow rapidly, grow slowly, stay the same or shrink in the future 13. Why is migration important in environmental science? 7.3 Many nations go through a demographic transition 14. Fill in the following chart to show how a population changes over the course of a demographic transition Phase Birth Rate Death Rate Growth Rate Level of economic development Level of medical care available Example Country(ies) Phase 1: Pre-Industrial Phase 2: Transitional Phase 3: Industrial Phase 4: Post Industrial high high low low low Lesotho 15. List some of the challenges faced by countries in each phase of the demographic transition: a. Phase 1 – b. Phase 2 – c. Phase 3 – d. Phase 4 – 7.4 Population size a consumption interact to influence the environment 16. . 17. . 18. . 19. . 7.5 Sustainable development is a common, if elusive, goal 20. . WTS – Gender Equity and Population Control in Kerala 21. Why is India’s population continuing to grow even though their growth rate is down to 1.5%? There is a vocab word for this phenomenon! 22. How did Kerala reduce their birth rate, mortality rate and TFR? 23. Why is gender equity critical to population control?


