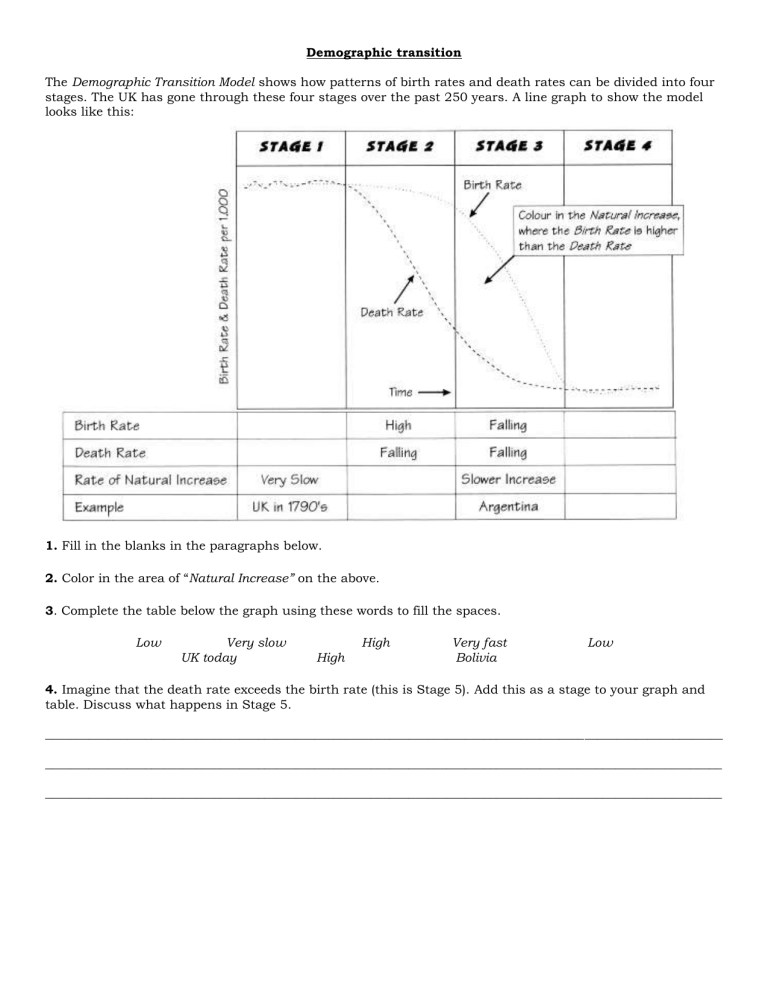
Demographic transition The Demographic Transition Model shows how patterns of birth rates and death rates can be divided into four stages. The UK has gone through these four stages over the past 250 years. A line graph to show the model looks like this: 1. Fill in the blanks in the paragraphs below. 2. Color in the area of “Natural Increase” on the above. 3. Complete the table below the graph using these words to fill the spaces. Low Very slow UK today High High Very fast Bolivia Low 4. Imagine that the death rate exceeds the birth rate (this is Stage 5). Add this as a stage to your graph and table. Discuss what happens in Stage 5. ____________________________________________________________________________________________________________ ____________________________________________________________________________________________________________ ____________________________________________________________________________________________________________ Total fertility rate (TFR): the average number of children born alive to each woman in her lifetime. If the TFR is more than 2, then the population increases. If TFR is equal to 2, then the population stays stable. If the TFR is less than 2 then the population of the country decreases. What will be the future world population? Three billion women will decide the size of the world population. A TFR of 2.0 means that a couple replaces themselves. In this scenario the population will increase from 6 billion now to 10.8 billion. If every second woman decides to have three rather than two children, a fertility rate of 2.5, the population will rise to 27 billion by 2150. If, however, every second woman decides to have only one child instead of two, a fertility rate of 1.5, the world population will sink to 3.6 billion. Total world fertility is now about 3.0, 1.7 in developed regions, and averaging 3.4 (but up to 6.0) in developing regions. The UN has calculated estimates for population change based on fertility rates stabilizing at 2.6 (high), 2.1 (medium/replacement level) and 1.6 (low). Age-structure pyramids show the relative number of individuals of each age in a population. They can be used to explain demographic patterns. Match the descriptions below with the corresponding age-structure pyramid. Words: no growth, rapid growth, slow growth


