Instruction Sheet
advertisement
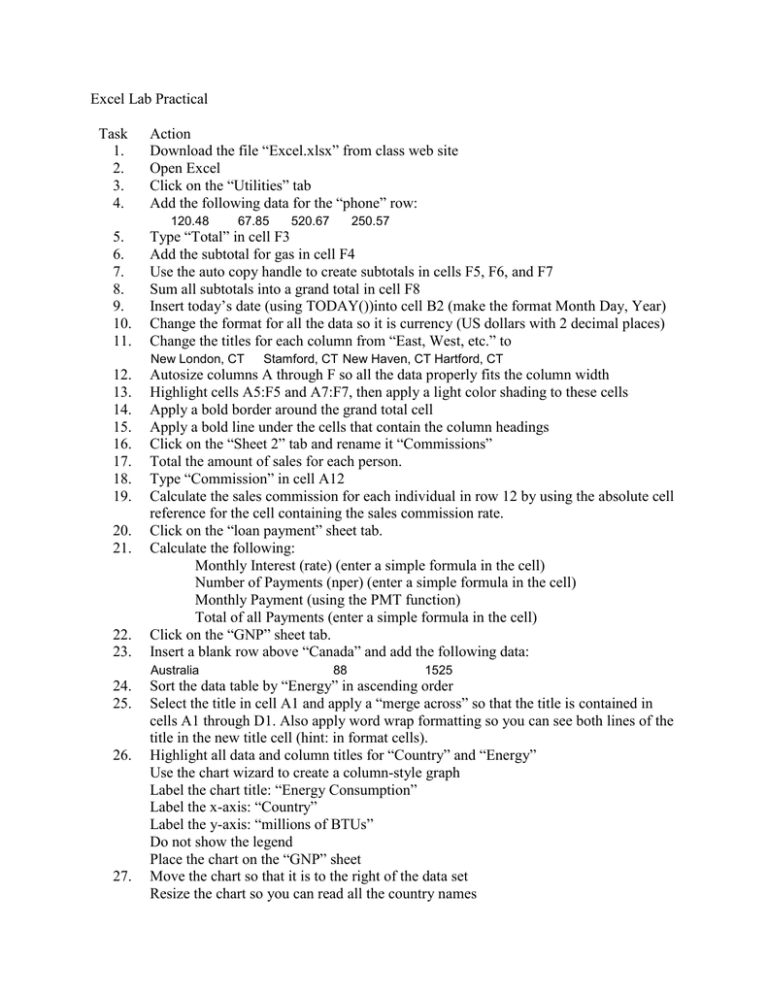
Excel Lab Practical Task 1. 2. 3. 4. Action Download the file “Excel.xlsx” from class web site Open Excel Click on the “Utilities” tab Add the following data for the “phone” row: 120.48 67.85 520.67 250.57 5. 6. 7. 8. 9. 10. 11. Type “Total” in cell F3 Add the subtotal for gas in cell F4 Use the auto copy handle to create subtotals in cells F5, F6, and F7 Sum all subtotals into a grand total in cell F8 Insert today’s date (using TODAY())into cell B2 (make the format Month Day, Year) Change the format for all the data so it is currency (US dollars with 2 decimal places) Change the titles for each column from “East, West, etc.” to 12. 13. 14. 15. 16. 17. 18. 19. Autosize columns A through F so all the data properly fits the column width Highlight cells A5:F5 and A7:F7, then apply a light color shading to these cells Apply a bold border around the grand total cell Apply a bold line under the cells that contain the column headings Click on the “Sheet 2” tab and rename it “Commissions” Total the amount of sales for each person. Type “Commission” in cell A12 Calculate the sales commission for each individual in row 12 by using the absolute cell reference for the cell containing the sales commission rate. Click on the “loan payment” sheet tab. Calculate the following: Monthly Interest (rate) (enter a simple formula in the cell) Number of Payments (nper) (enter a simple formula in the cell) Monthly Payment (using the PMT function) Total of all Payments (enter a simple formula in the cell) Click on the “GNP” sheet tab. Insert a blank row above “Canada” and add the following data: New London, CT 20. 21. 22. 23. Australia 24. 25. 26. 27. Stamford, CT New Haven, CT Hartford, CT 88 1525 Sort the data table by “Energy” in ascending order Select the title in cell A1 and apply a “merge across” so that the title is contained in cells A1 through D1. Also apply word wrap formatting so you can see both lines of the title in the new title cell (hint: in format cells). Highlight all data and column titles for “Country” and “Energy” Use the chart wizard to create a column-style graph Label the chart title: “Energy Consumption” Label the x-axis: “Country” Label the y-axis: “millions of BTUs” Do not show the legend Place the chart on the “GNP” sheet Move the chart so that it is to the right of the data set Resize the chart so you can read all the country names 28. 29. 30. 31. Change the page setup so that the GNP sheet can be viewed in landscape view; change the scaling so that it fits on 1 page wide by 1 page tall. Insert your name into the left section of the page footer, and the date into the right section of the page footer. Print preview your document. Save all changes to your file (same file name), then close the file and exit Excel.

![How to create a Graph in Excel [3/1/2012]](http://s2.studylib.net/store/data/010103557_1-9a59b79fa385c6b07c88637e88f1732e-300x300.png)
