Numerical simulation of the tephra fallout and plume evolution of
advertisement
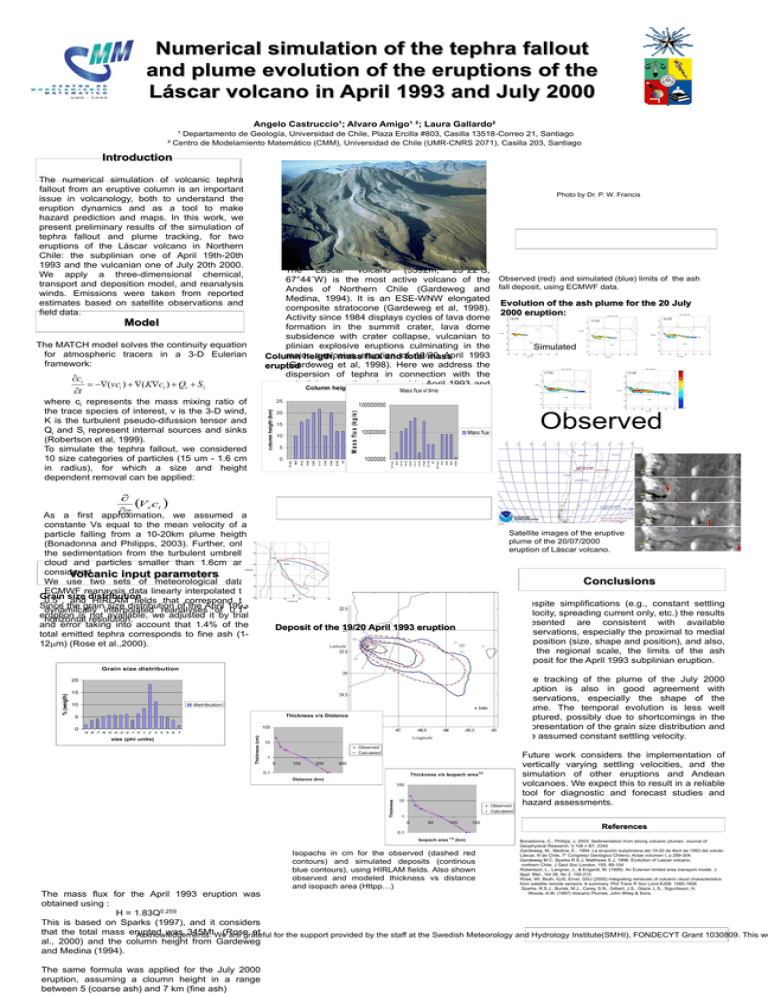
Numerical simulation of the tephra fallout and plume evolution of the eruptions of the Láscar volcano in April 1993 and July 2000 Angelo Castruccio¹; Alvaro Amigo¹ ²; Laura Gallardo² ¹ Departamento de Geología, Universidad de Chile, Plaza Ercilla #803, Casilla 13518-Correo 21, Santiago ² Centro de Modelamiento Matemático (CMM), Universidad de Chile (UMR-CNRS 2071), Casilla 203, Santiago Introduction The numerical simulation of volcanic tephra fallout from an eruptive column is an important issue in volcanology, both to understand the eruption dynamics and as a tool to make hazard prediction and maps. In this work, we present preliminary results of the simulation of tephra fallout and plume tracking, for two eruptions of the Láscar volcano in Northern Chile: the subplinian one of April 19th-20th 1993 and the vulcanian one of July 20th 2000. We apply a three-dimensional chemical, transport and deposition model, and reanalysis winds. Emissions were taken from reported estimates based on satellite observations and field data. Photo by Dr. P. W. Francis Láscar volcano The Láscar volcano (5592m, 23°22´S, 67°44´W) is the most active volcano of the Observed (red) and simulated (blue) limits of the ash Andes of Northern Chile (Gardeweg and fall deposit, using ECMWF data. Medina, 1994). It is an ESE-WNW elongated Evolution of the ash plume for the 20 July composite stratocone (Gardeweg et al, 1998). 2000 eruption: Activity since 1984 displays cycles of lava dome formation in the summit crater, lava dome subsidence with crater collapse, vulcanian to plinian explosive eruptions culminating in the Simulated major explosive 19/20 April 1993 Column heigth, masseruption flux andoftotal mass (Gardeweg et al, 1998). Here we address the erupted dispersion of tephra in connection with the subplinian eruption observed in April 1993 and the vulcanian eruption of July 20 2000. Model The MATCH model solves the continuity equation for atmospheric tracers in a 3-D Eulerian framework: ci (vci ) ( Kci ) Qi S i t where ci represents the mass mixing ratio of the trace species of interest, v is the 3-D wind, K is the turbulent pseudo-difussion tensor and Qi and Si represent internal sources and sinks (Robertson et al, 1999). To simulate the tephra fallout, we considered 10 size categories of particles (15 um - 1.6 cm in radius), for which a size and height dependent removal can be applied: Observed Vs ci z As a first approximation, we assumed a constante Vs equal to the mean velocity of a particle falling from a 10-20km plume heigth (Bonadonna and Philipps, 2003). Further, only the sedimentation from the turbulent umbrella cloud and particles smaller than 1.6cm are considered. Volcanic input parameters We use two sets of meteorological data: ECMWF reanaysis data linearly interpolated to Grain size distribution 0.5°, and HIRLAM fields that correspond to Since the grain size distribution of the April 1993 dynamilcally interpolated reanalyses of 0.1° eruption is not available, we adjusted it by trial horizontal resolution. and error taking into account that 1.4% of the total emitted tephra corresponds to fine ash (112m) (Rose et al.,2000). Satellite images of the eruptive plume of the 20/07/2000 eruption of Láscar volcano. Conclusions Despite simplifications (e.g., constant settling velocity, spreading current only, etc.) the results presented are consistent with available observations, especially the proximal to medial deposition (size, shape and position), and also, at the regional scale, the limits of the ash deposit for the April 1993 subplinian eruption. Results Deposit of the 19/20 April 1993 eruption Grain size distribution The tracking of the plume of the July 2000 eruption is also in good agreement with observations, especially the shape of the plume. The temporal evolution is less well captured, possibly due to shortcomings in the representation of the grain size distribution and the assumed constant settling velocity. % (weigth) 20 15 10 distribution Thickness v/s Distance 5 100 0 size (phi units) Thickness (cm) -9 -8 -7 -6 -5 -4 -3 -2 -1 0 1 2 3 4 5 6 7 10 Observed Calculated 1 0 100 200 300 0,1 Thickness v/s Isopach area1/2 Distance (km) Thickness 100 10 Observed Calculated Future work considers the implementation of vertically varying settling velocities, and the simulation of other eruptions and Andean volcanoes. We expect this to result in a reliable tool for diagnostic and forecast studies and hazard assessments. 1 0 50 100 150 References 0,1 Isopach area 1/2 (km) Isopachs in cm for the observed (dashed red contours) and simulated deposits (continous blue contours), using HIRLAM fields. Also shown observed and modeled thickness vs distance and isopach area (Httpp…) Bonadonna, C., Phillips, J, 2003: Sedimentation from strong volcanic plumes. Journal of Geophysical Research. V.108 n B7, 2340 Gardeweg, M., Medina, E., 1994: La erupción subpliniana del 19-20 de Abril de 1993 del volcán Láscar, N de Chile, 7° Congreso Geológico Chileno, Actas volumen I, p 299-304. Gardeweg M C, Sparks R S J, Matthews S J, 1998. Evolution of Lascar volcano, northern Chile. J Geol Soc London, 155: 89-104 Robertson, L., Langner, J., & Engardt, M. (1999). An Eulerian limited area transport model. J. Appl. Met., Vol 38, No 2, 190-210. Rose, WI, Bluth, GJS, Ernst, GGJ (2000) Integrating retrievals of volcanic cloud characteristics from satellite remote sensors: A summary. Phil Trans R Soc Lond A358: 1585-1606 Sparks, R.S.J., Bursik, M.J., Carey, S.N., Gilbert, J.S., Glaze, L.S., Sigurdsson, H. Woods, A.W. (1997) Volcanic Plumes, John Wiley & Sons. The mass flux for the April 1993 eruption was obtained using : H = 1.83Q0.259 This is based on Sparks (1997), and it considers that the total mass erupted was 345MtWe(Rose et for the support provided by the staff at the Swedish Meteorology and Hydrology Institute(SMHI), FONDECYT Grant 1030809. This wo Acknowledgements. are grateful al., 2000) and the column height from Gardeweg and Medina (1994). The same formula was applied for the July 2000 eruption, assuming a cloumn height in a range between 5 (coarse ash) and 7 km (fine ash)
