Chp 11 Study Guide & Review
advertisement
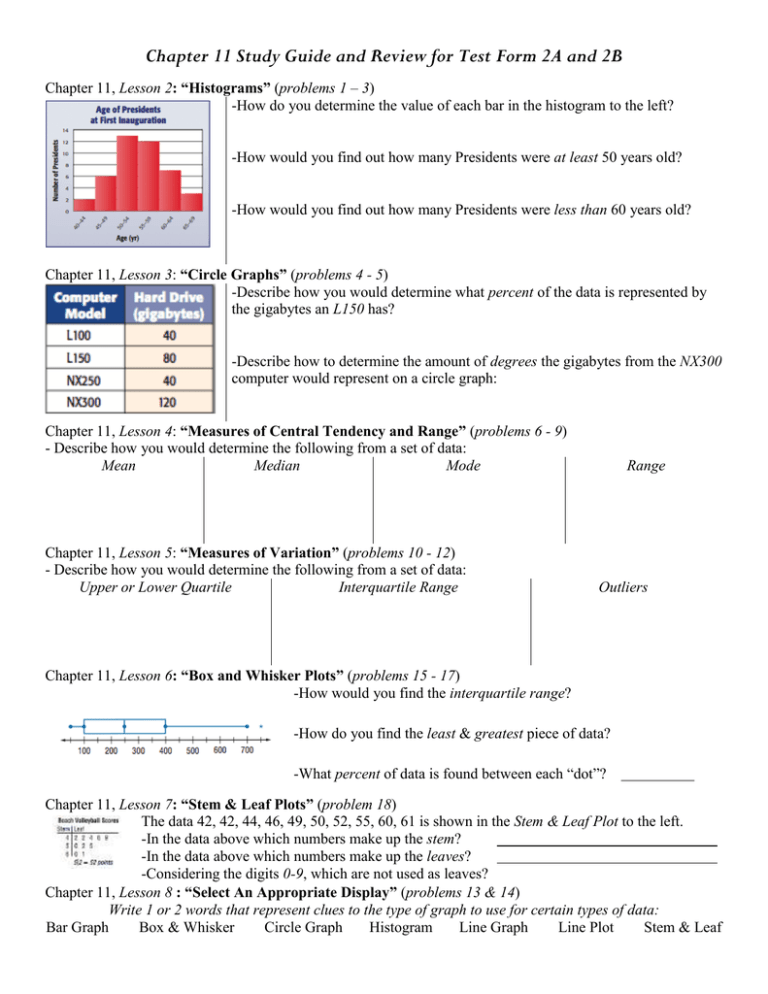
Chapter 11 Study Guide and Review for Test Form 2A and 2B Chapter 11, Lesson 2: “Histograms” (problems 1 – 3) -How do you determine the value of each bar in the histogram to the left? -How would you find out how many Presidents were at least 50 years old? -How would you find out how many Presidents were less than 60 years old? Chapter 11, Lesson 3: “Circle Graphs” (problems 4 - 5) -Describe how you would determine what percent of the data is represented by the gigabytes an L150 has? -Describe how to determine the amount of degrees the gigabytes from the NX300 computer would represent on a circle graph: Chapter 11, Lesson 4: “Measures of Central Tendency and Range” (problems 6 - 9) - Describe how you would determine the following from a set of data: Mean Median Mode Chapter 11, Lesson 5: “Measures of Variation” (problems 10 - 12) - Describe how you would determine the following from a set of data: Upper or Lower Quartile Interquartile Range Range Outliers Chapter 11, Lesson 6: “Box and Whisker Plots” (problems 15 - 17) -How would you find the interquartile range? -How do you find the least & greatest piece of data? -What percent of data is found between each “dot”? Chapter 11, Lesson 7: “Stem & Leaf Plots” (problem 18) The data 42, 42, 44, 46, 49, 50, 52, 55, 60, 61 is shown in the Stem & Leaf Plot to the left. -In the data above which numbers make up the stem? -In the data above which numbers make up the leaves? -Considering the digits 0-9, which are not used as leaves? Chapter 11, Lesson 8 : “Select An Appropriate Display” (problems 13 & 14) Write 1 or 2 words that represent clues to the type of graph to use for certain types of data: Bar Graph Box & Whisker Circle Graph Histogram Line Graph Line Plot Stem & Leaf
