exam - Homework Market
advertisement
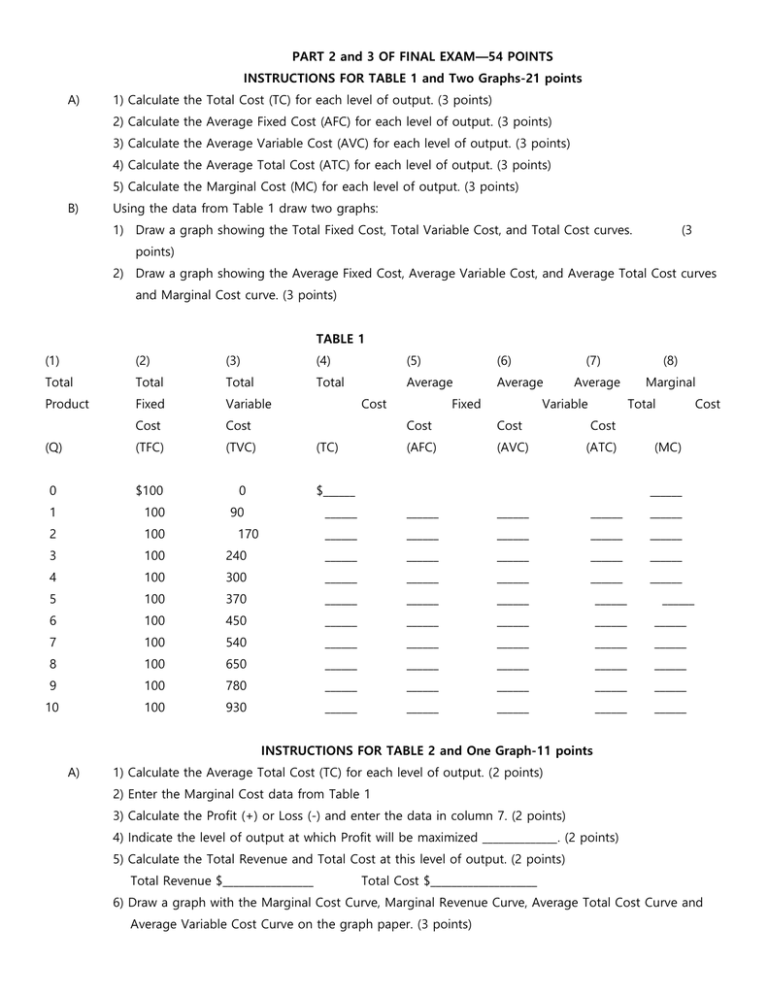
PART 2 and 3 OF FINAL EXAM—54 POINTS INSTRUCTIONS FOR TABLE 1 and Two Graphs-21 points A) 1) Calculate the Total Cost (TC) for each level of output. (3 points) 2) Calculate the Average Fixed Cost (AFC) for each level of output. (3 points) 3) Calculate the Average Variable Cost (AVC) for each level of output. (3 points) 4) Calculate the Average Total Cost (ATC) for each level of output. (3 points) 5) Calculate the Marginal Cost (MC) for each level of output. (3 points) B) Using the data from Table 1 draw two graphs: 1) Draw a graph showing the Total Fixed Cost, Total Variable Cost, and Total Cost curves. (3 points) 2) Draw a graph showing the Average Fixed Cost, Average Variable Cost, and Average Total Cost curves and Marginal Cost curve. (3 points) TABLE 1 (1) (2) (3) (4) (5) (6) Total Total Total Total Average Average Product Fixed Variable Cost Cost (Q) (TFC) (TVC) 0 $100 0 $______ 1 100 90 ______ ______ ______ ______ ______ 2 100 ______ ______ ______ ______ ______ 3 100 240 ______ ______ ______ ______ ______ 4 100 300 ______ ______ ______ ______ ______ 5 100 370 ______ ______ ______ ______ 6 100 450 ______ ______ ______ ______ ______ 7 100 540 ______ ______ ______ ______ ______ 8 100 650 ______ ______ ______ ______ ______ 9 100 780 ______ ______ ______ ______ ______ 10 100 930 ______ ______ ______ ______ ______ Cost (TC) 170 Fixed (7) Average Variable (8) Marginal Total Cost Cost Cost (AFC) (AVC) (ATC) Cost (MC) ______ ______ INSTRUCTIONS FOR TABLE 2 and One Graph-11 points A) 1) Calculate the Average Total Cost (TC) for each level of output. (2 points) 2) Enter the Marginal Cost data from Table 1 3) Calculate the Profit (+) or Loss (-) and enter the data in column 7. (2 points) 4) Indicate the level of output at which Profit will be maximized ______________. (2 points) 5) Calculate the Total Revenue and Total Cost at this level of output. (2 points) Total Revenue $_________________ Total Cost $____________________ 6) Draw a graph with the Marginal Cost Curve, Marginal Revenue Curve, Average Total Cost Curve and Average Variable Cost Curve on the graph paper. (3 points) TABLE 2 (1) (2) (3) (4) (5) (6) Total Average Average Average Marginal Price= Product Fixed Variable Total Cost (7) Total Economic Marginal Profit (+) Cost (Q) (AFC) Cost Cost (AVC) (ATC) Revenue or Loss (-) (MC) 0 1 $100.00 2 50.00 3 33.33 $90.00 ______ ______ $131 85.00 ______ ______ $131 ______ ______ 80.00 ______ ______ $131 ______ 75.00 ______ ______ $131 ______ 4 25.00 5 20.00 74.00 ______ ______ $131 ______ 6 16.67 75.00 ______ ______ $131 ______ 7 14.29 8 77.14 12.50 81.25 ______ ______ ______ ______ $131 $131 ______ ______ 9 11.11 86.67 ______ ______ $131 ______ 10 10.00 93.00 ______ ______ $131 ______ PART 3 OF FINAL EXAM—22 POINTS TABLE ON ORGANIZATION AND FINANCING OF BUSINESS (22 points) In the fill-in-the-blank boxes below you must put in the correct answers based upon the table that is in the lecture notes. Please DO NOT be creative. Please DO NOT use your own words. Use the exact language that is in the lecture notes. If there are problems, I will review answers. MAKE SURE THAT YOU FOLLOW THE NUMERICAL SEQUENCE OF THE ANSWERS, OTHERWISE YOUR ANSWERS WILL BE MARKED WRONG. TYPE OF BUSINESS FINANCING PROPRIETORSHIP 1, 2 PARTNERSHIP 7-9 14-18 CORPORATION LENGTH OF LIFE 3 LIABILITY WHO GETS PROFITS? WHO MAKES DECISIONS? 4 5 6 10 11 12 13 19 20 21 22 PROPRIETORSHIP FINANCING 1. 2. PROPRIETORSHIP--LENGTH OF LIFE (one word) 3. PROPRIETORSHIP--LIABILITY (one word) 4. PROPRIETORSHIP-WHO GETS PROFITS? (one word) 5. PROPRIETORSHIP--WHO MAKES DECISIONS? 6. PARTNERSHIP--FINANCING 7. 8. 9. PARTNERSHIP--LENGTH OF LIFE 10. PARTNERSHIP--LIABILITY 11. PARTNERSHIP--WHO GETS PROFITS? 12. PARTNERSHIP--WHO MAKES DECISIONS? 13. CORPORATION--FINANCING 14. 15. 16. 17. 18. CORPORATION--LENGTH OF LIFE 19. CORPORATION--LIABILITY (one word) 20. CORPORATION--WHO GETS PROFITS (six words) 21. CORPORATION--WHO MAKES DECISIONS? (two words) 22.
